 |
This article explains how to use the Sponsor Workspace tool. To learn about this functionality in the Events Builder, click here. |
The Social27 Sponsors Dashboard gives you the data you need to understand how event attendees are interacting with your booth on the Social27 platform, enabling you to:
- Understand how many attendees are visiting your booth
- Identify which areas of interest are in common among your booth visitors
- View which resources and Playlists are most popular
- Review chats sent between attendees and your booth reps
- Download lists of attendees who filled out Contact Me / Lead Generation forms
- View sponsored meeting information and attendees
To access the Sponsors Dashboard, log in to the Sponsor Workspace and select your event. Select the booth you want to view data for and click Dashboard in the left navigation panel. Use the jump menu to navigate directly to a specific report or scroll down to view them all. (For Dashboard navigation tips, check out this article.)
Don’t forget to set your date range in the top right corner of the screen. For a full list of all fields that appear in the Dashboard reports, check out this spreadsheet.
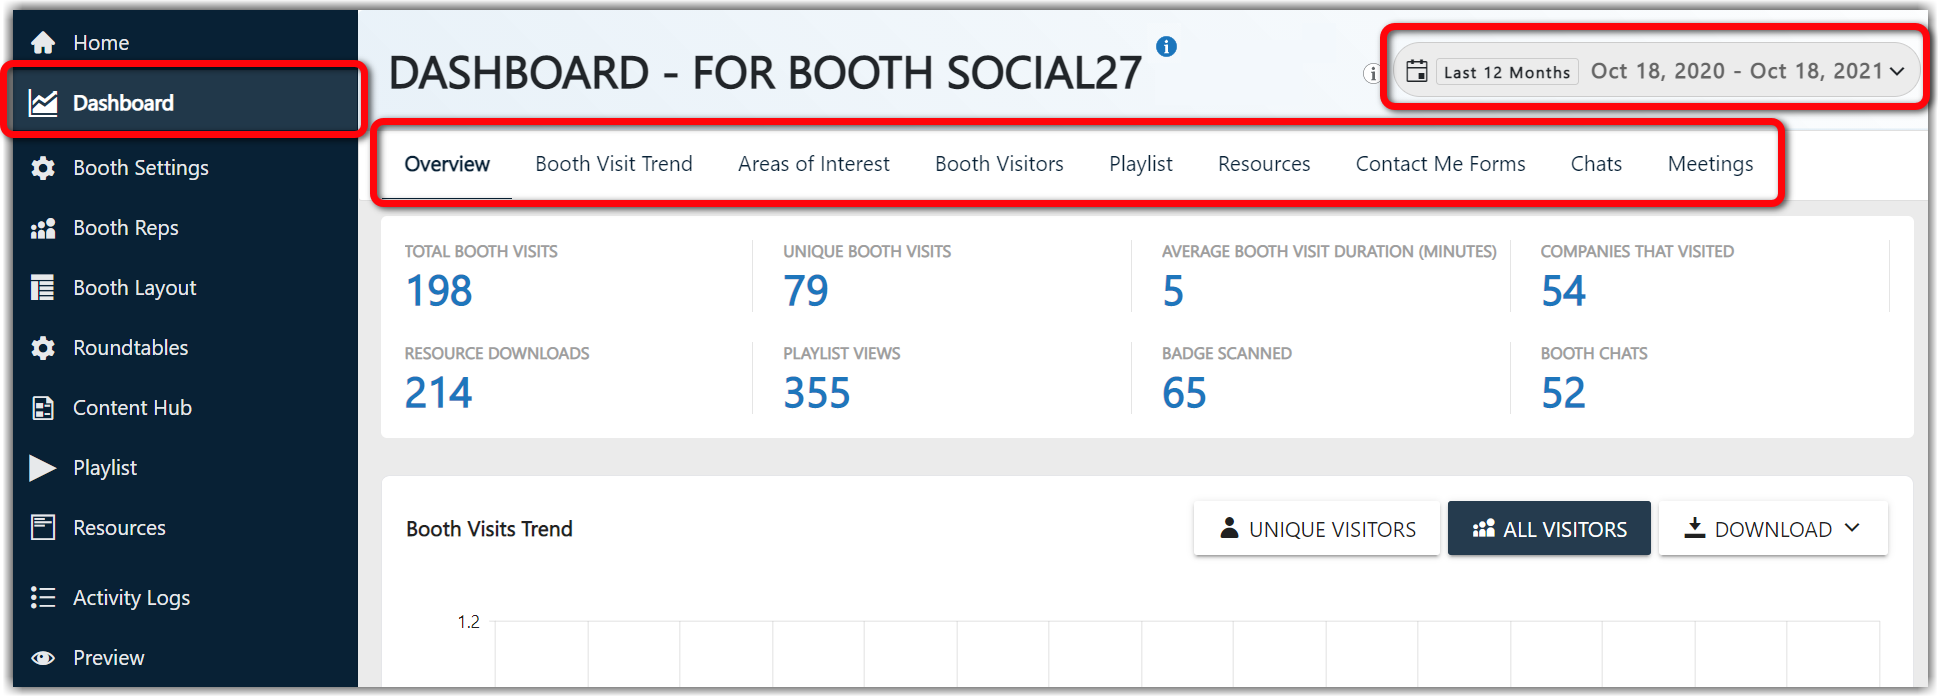
The Dashboard includes the following reports:
- Overview Statistics
- Booth Visits Trend
- Attendee Interest Area
- Booth Visitors
- Playlist
- Resources
- Contact Me Forms
- Chats
- Meetings
Overview Statistics
The statistics at the top of the Dashboard give you a quick understanding of your booth performance, including the number of booth visits (unique and non-unique), average booth visit duration, number of unique companies who visited, number of resource downloads and Playlist views, number of booth chats sent, and number of badge scans.

How Can I Use This Report?
- Get a picture of which companies are most interested in you and consider reaching out to the company rather than individual attendees.
- If you see low numbers of resource downloads, you can review your resources and consider adding resources that might be more useful for booth visitors.
- If you see low Playlist views, review your initial Playlist item to ensure it is is eye-catching and engaging.
Booth Visits Trend
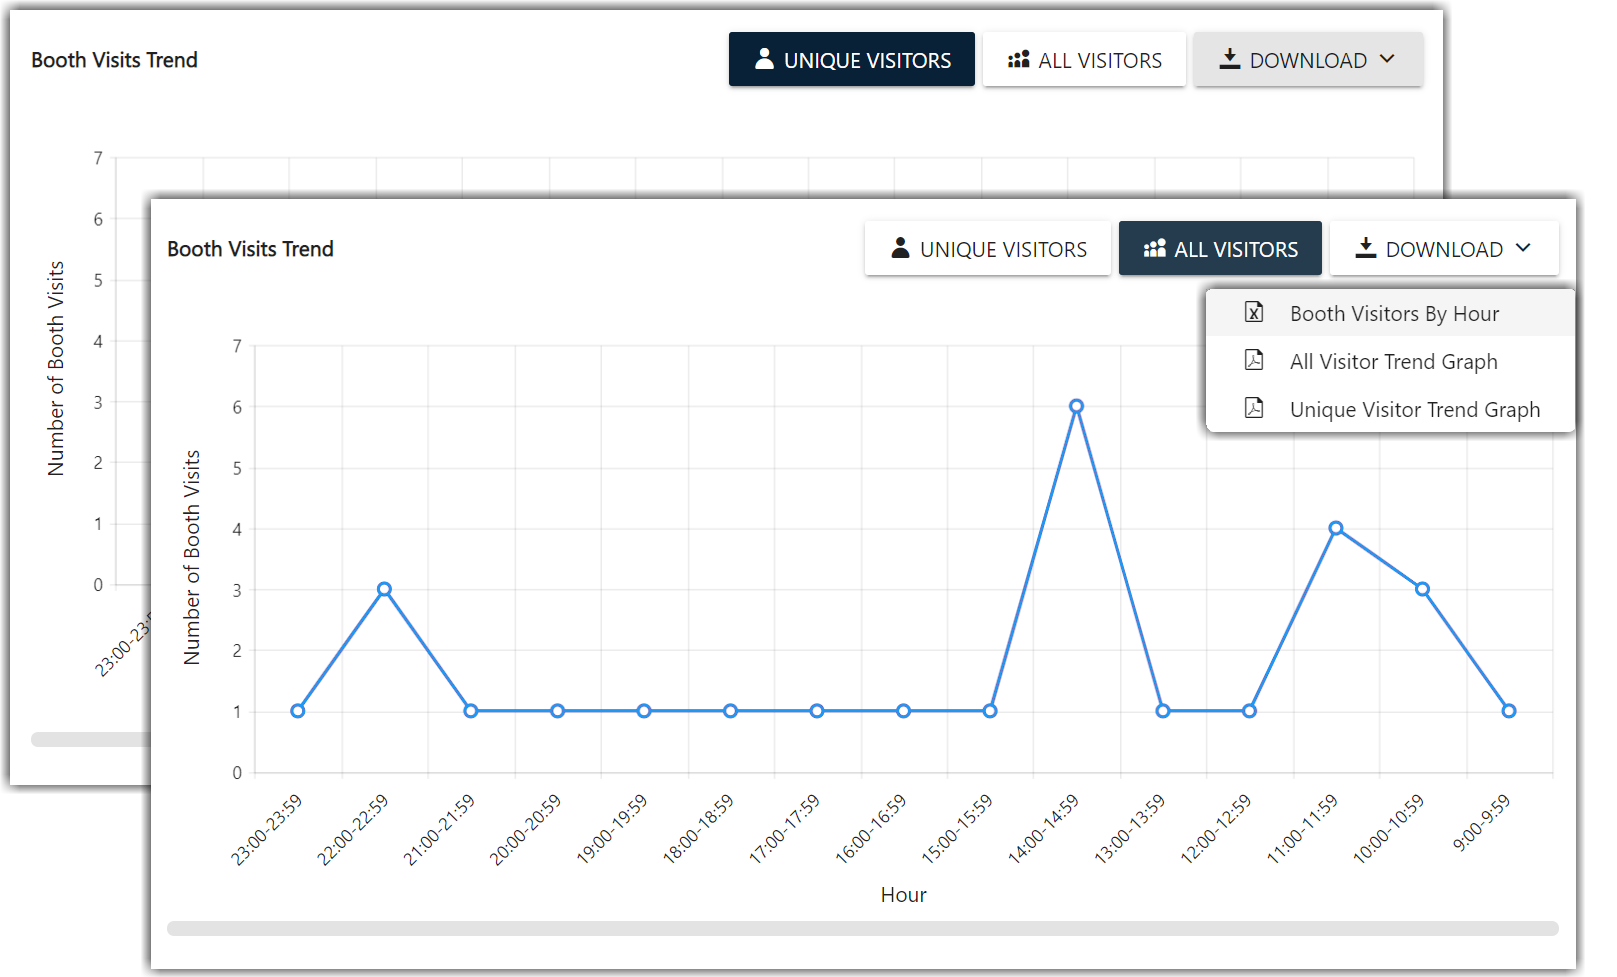
This report displays hourly visits for your booth. Use the buttons in the top right to switch between viewing data for unique vs. all visitors, and click the Download dropdown to download an Excel version of the report.
How Can I Use This Report?
- If you have low visitor counts, evaluate your booth page to see if you can increase attendance.
- Understand which hours are peak visitor times and ensure your booth reps are online.
Attendee Interest Area
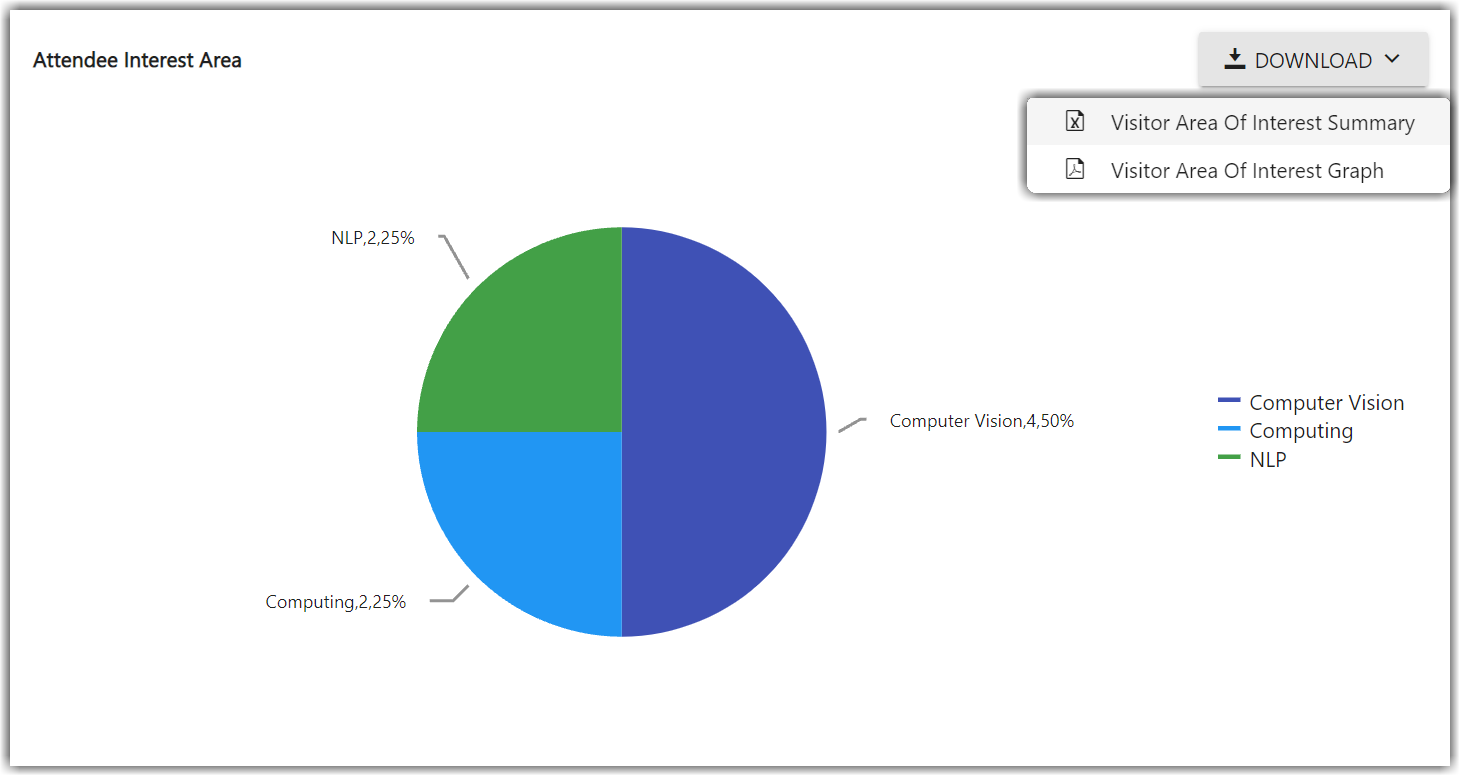
The Attendee Interest Area pie chart shows you which areas of interest (AOIs) have been selected by your booth visitors.
How Can I Use This Report?
- Looking at this report will tell you which AOIs are most popular among your booth visitors, and you can consider updating your booth content to directly address those interests.
Booth Visitors
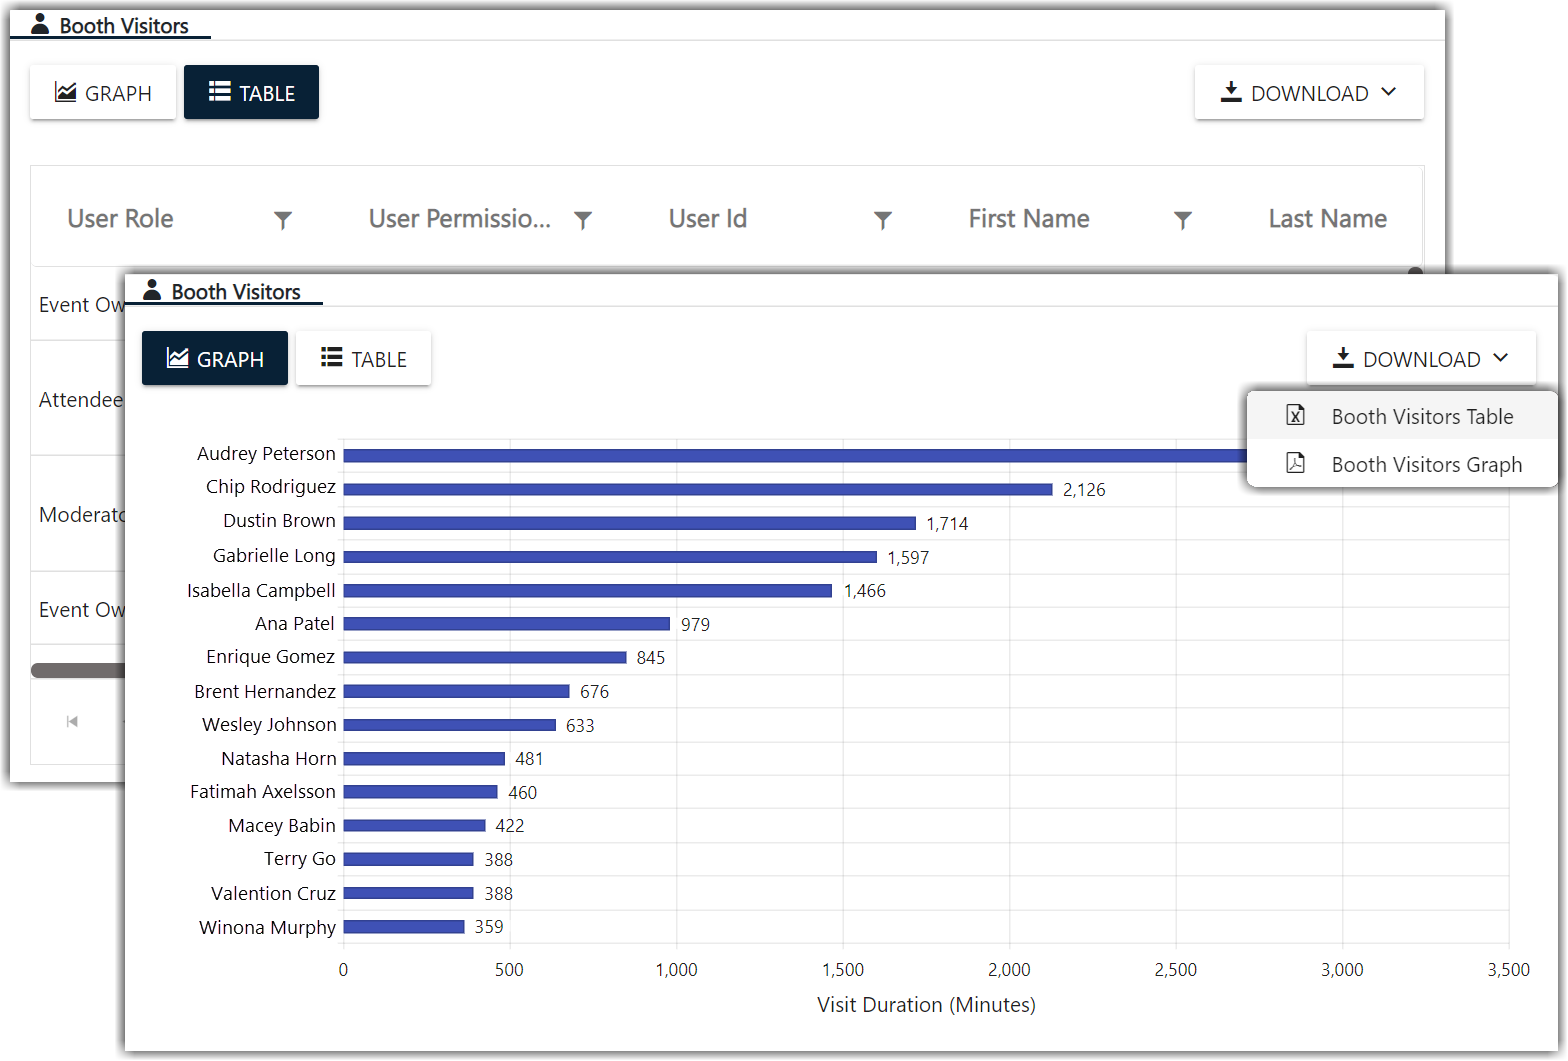
The Booth Visitors report shows how long each attendee has spent at your booth. Graph view shows you their total visit duration for all visits, and Table view shows you their average visit duration and the number of times they visited.
How Can I Use This Report?
- Check out which users are visiting your booth most often and consider connecting with them to deepen the relationship.
Playlist
The Playlist report has two different datasets: Summary and By User.
The Summary dataset tells you how many times each item Playlist item has been viewed.
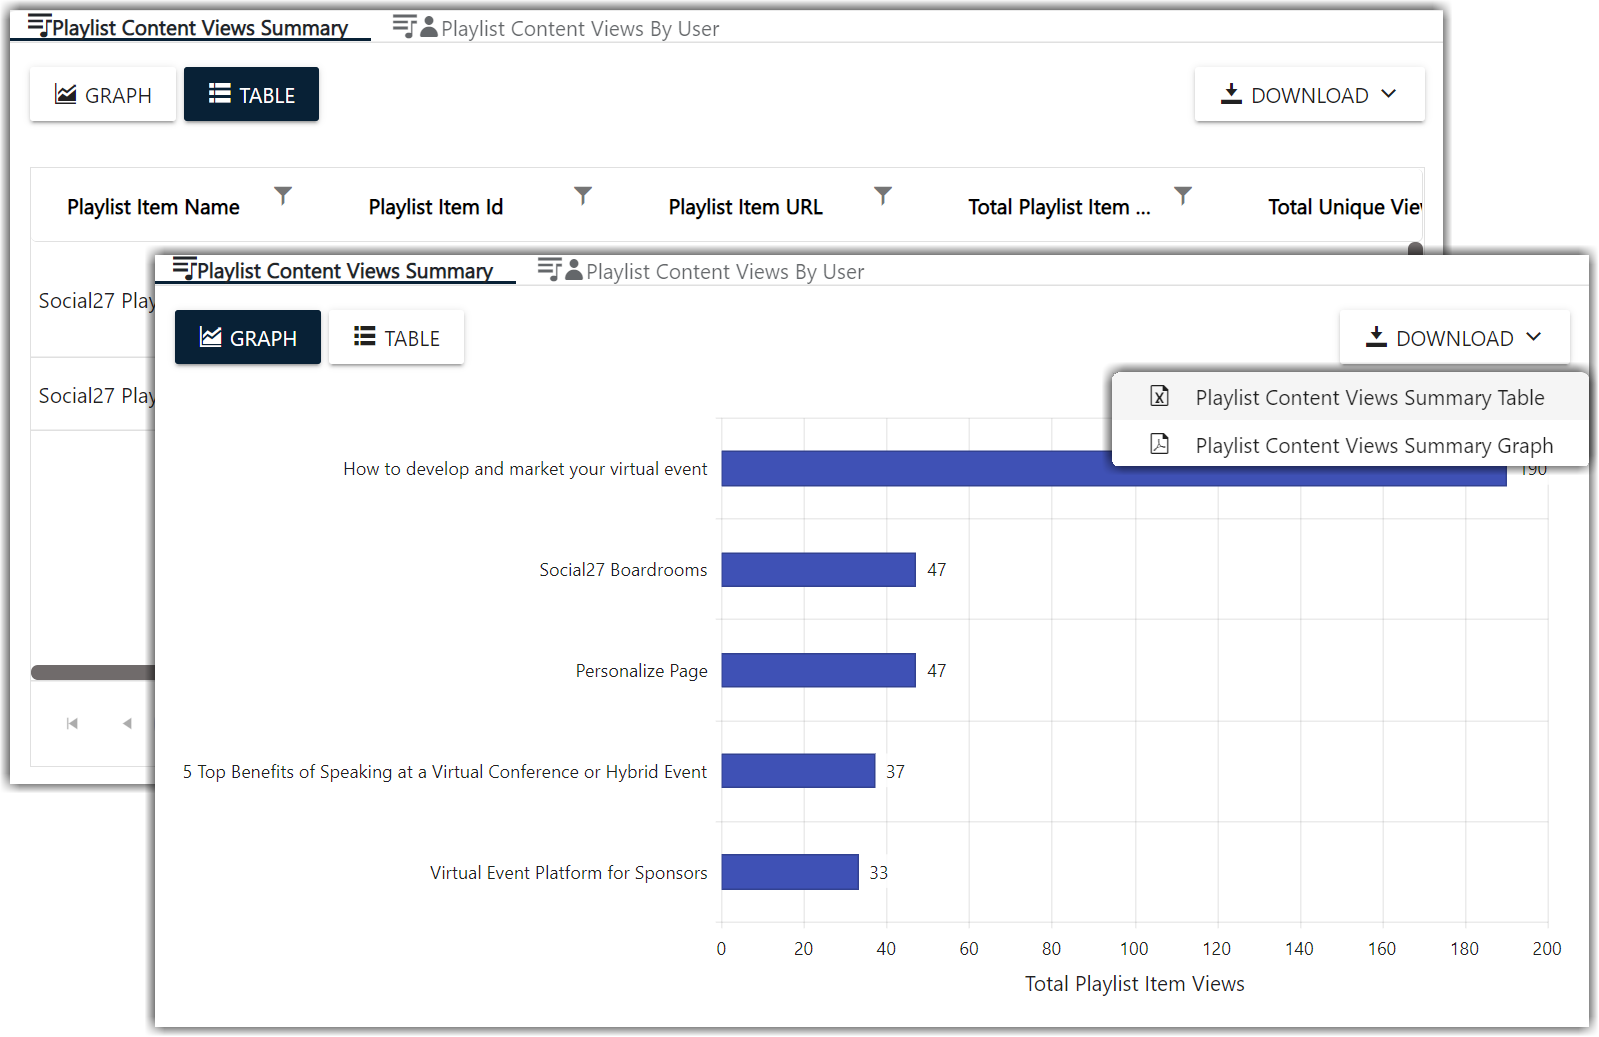
The By User dataset tells you which attendees have viewed each Playlist item (available only in Table format).
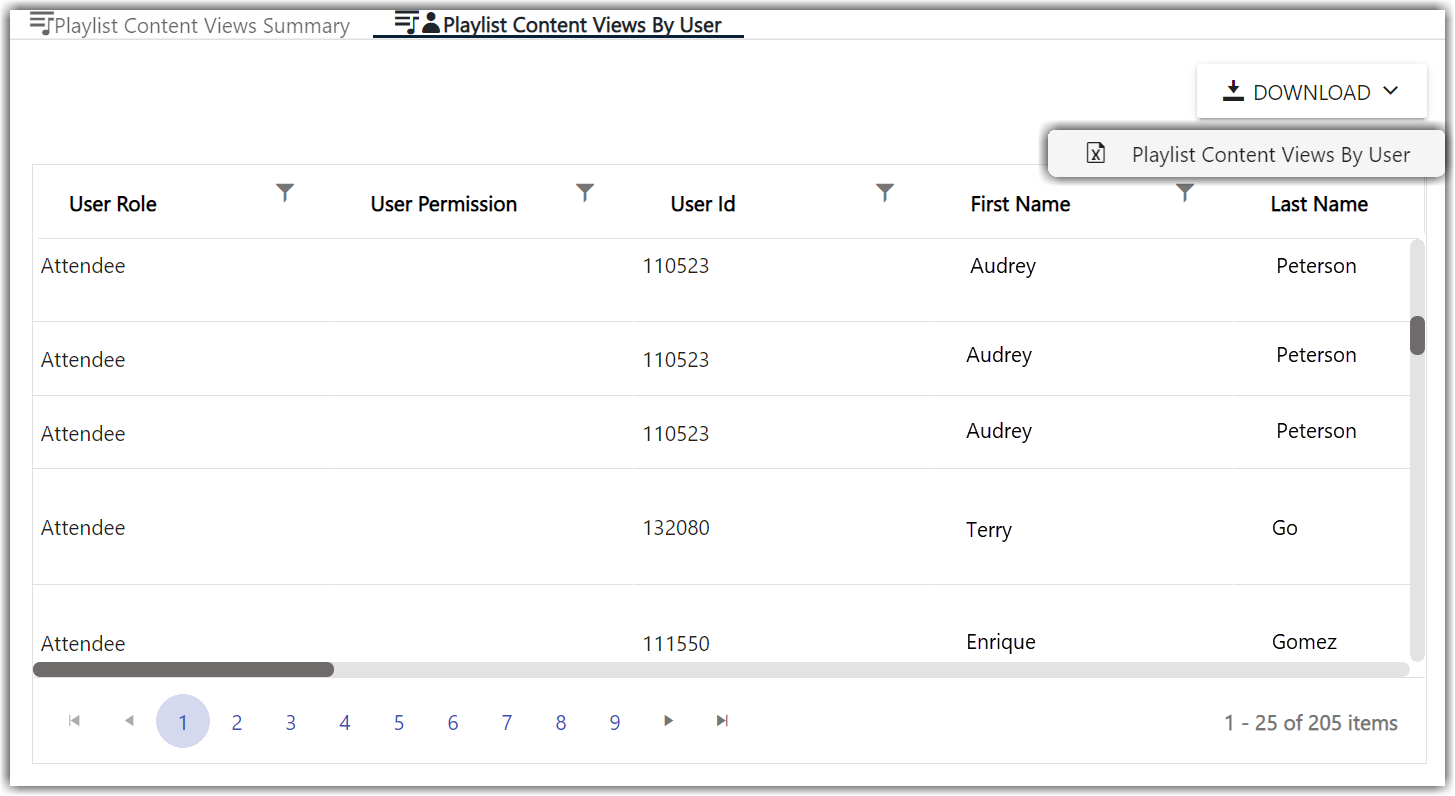
How Can I Use This Report?
- See which Playlist content items have high views and consider adding similar items to increase engagement.
- See which users have most actively been viewing your Playlist items and thank them for their interest.
Resources
The Resources report has two different datasets: Summary and By User.
The Summary dataset tells you how many times each resource has been downloaded.
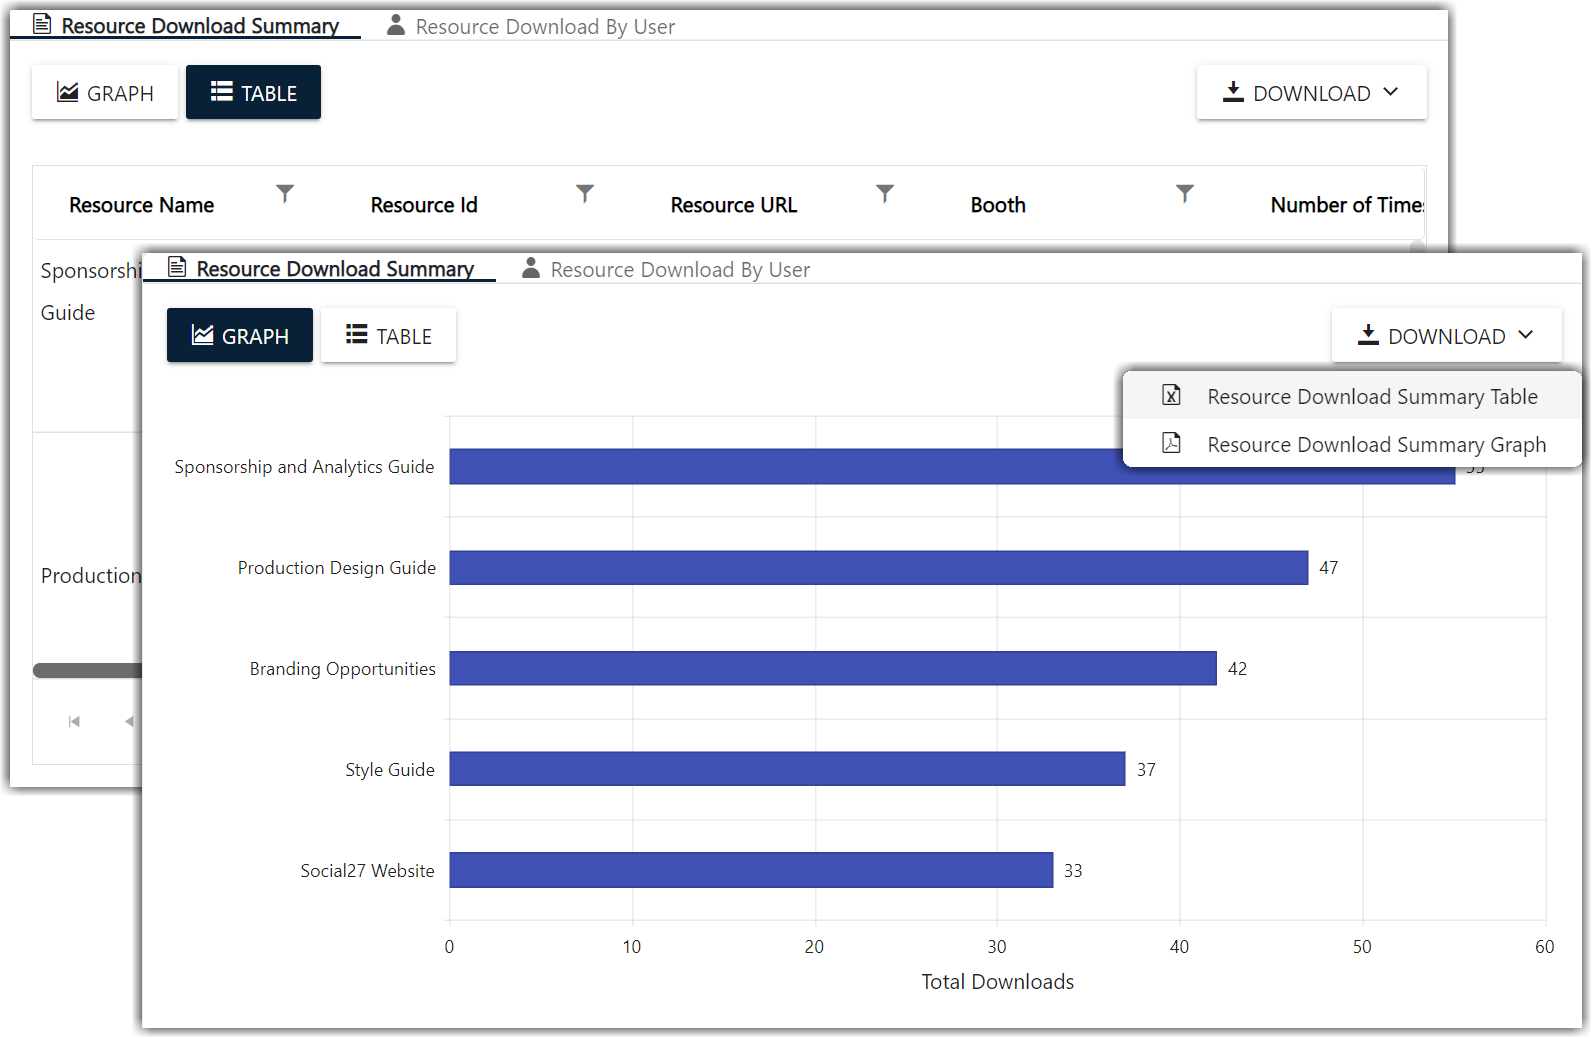
The By User dataset tells you which attendees have downloaded each resource (available only in Table format).
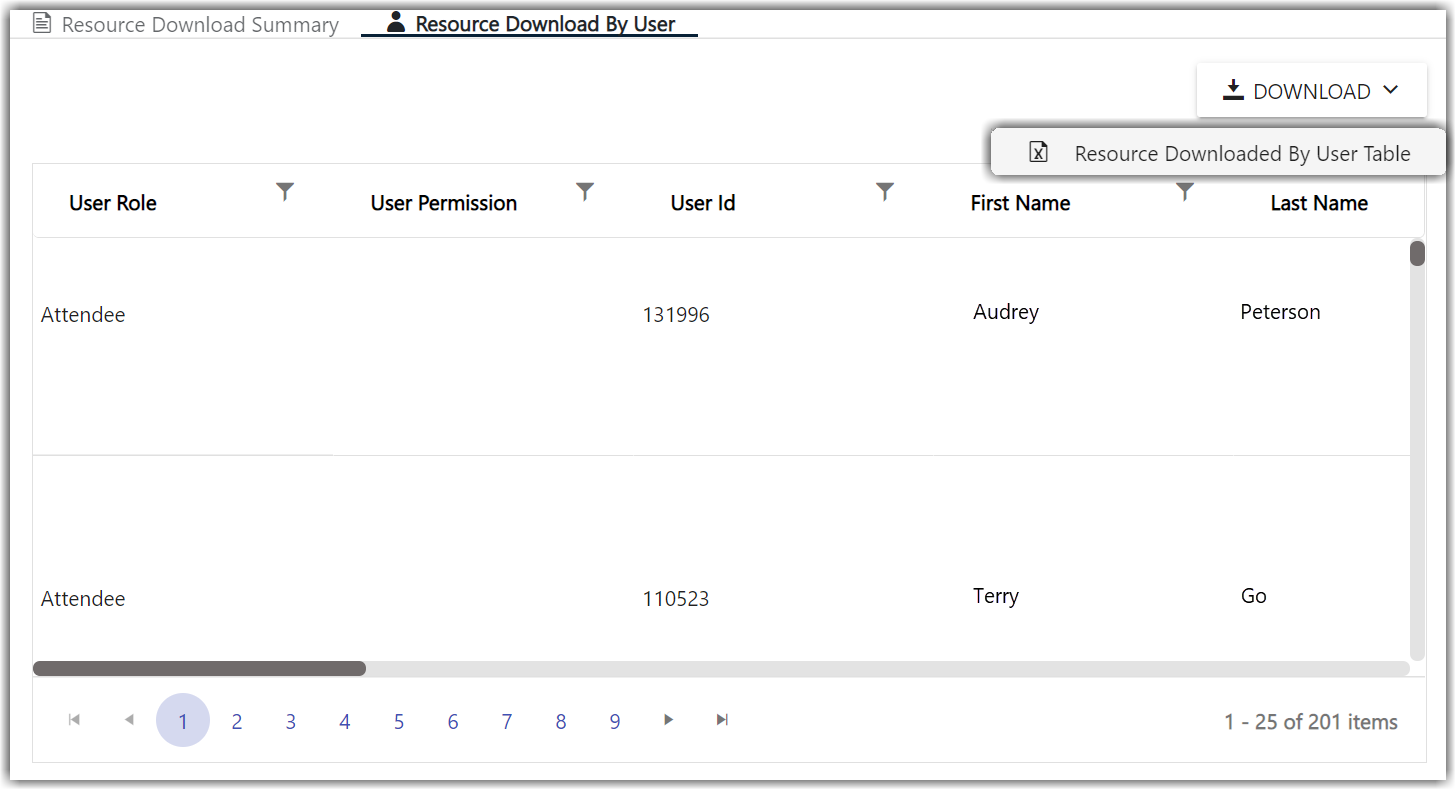
How Can I Use This Report?
- If you find that your booths doesn't have many resources, you can consider including some.
- See which users have most actively been downloading resources and thank them for their interest.
Sponsor Public Chat Log
This report displays all chats made on your booth.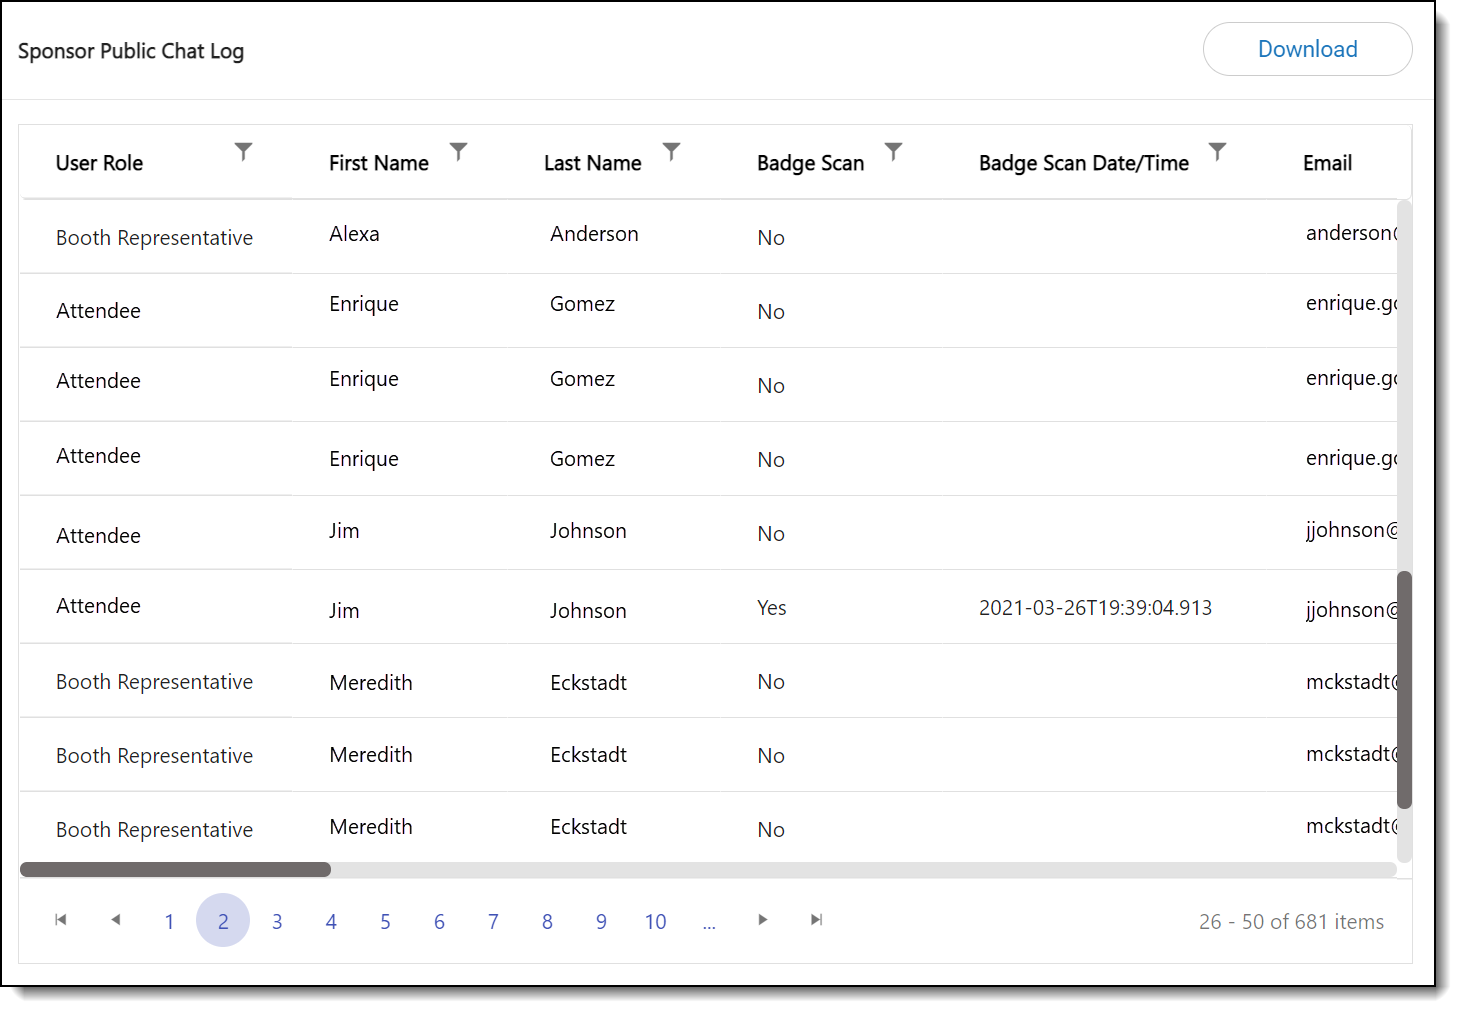
How Can I Use This Report?
- Check the chat details to ensure that all users’ questions were answered and reach out if any were missed.
- Filter the report to see which users are sending the most chats on sponsor booths and thank them for their participation.
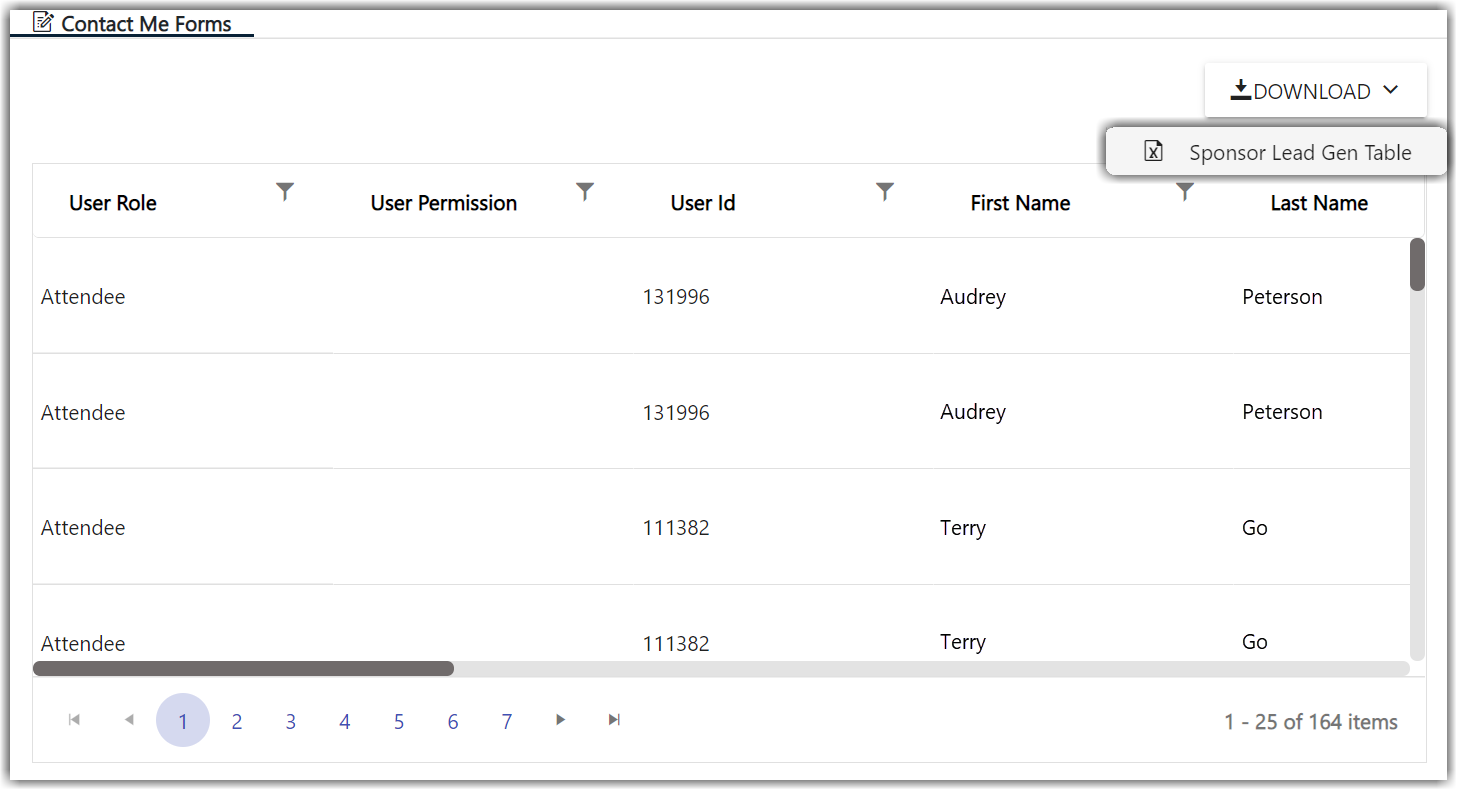
Contact Me Forms
This report provides contact information for users who completed a Lead Generation form when they visited your booth.
How Can I Use This Report?
- Reach out to users who completed the Lead Generation form and provide more information about your organization.
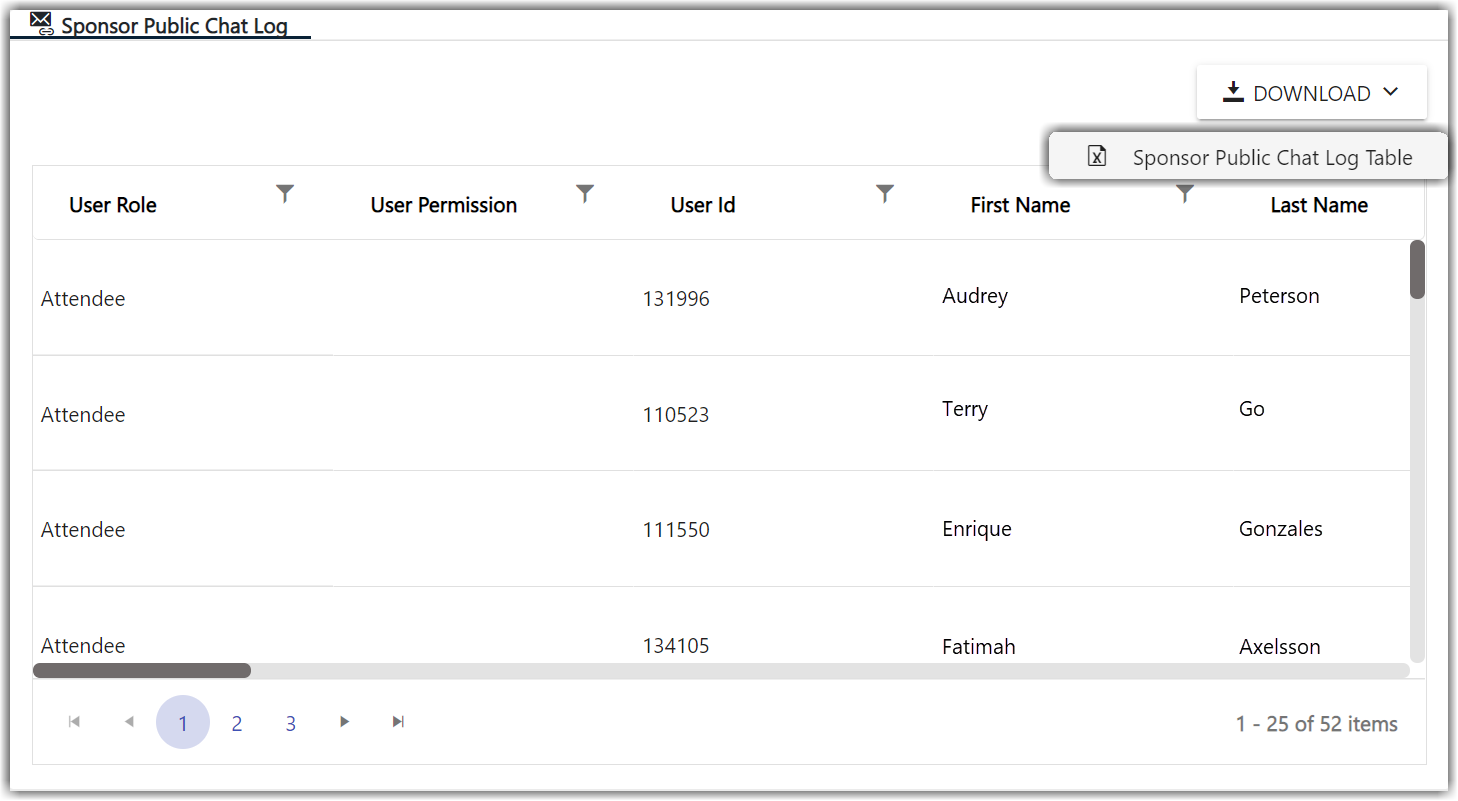
Chats
This report provides all chat information for chats sent on your booth.
How Can I Use This Report?
- Review the chats sent on your booth, answer questions, and connect with attendees to provide additional information.
Meetings
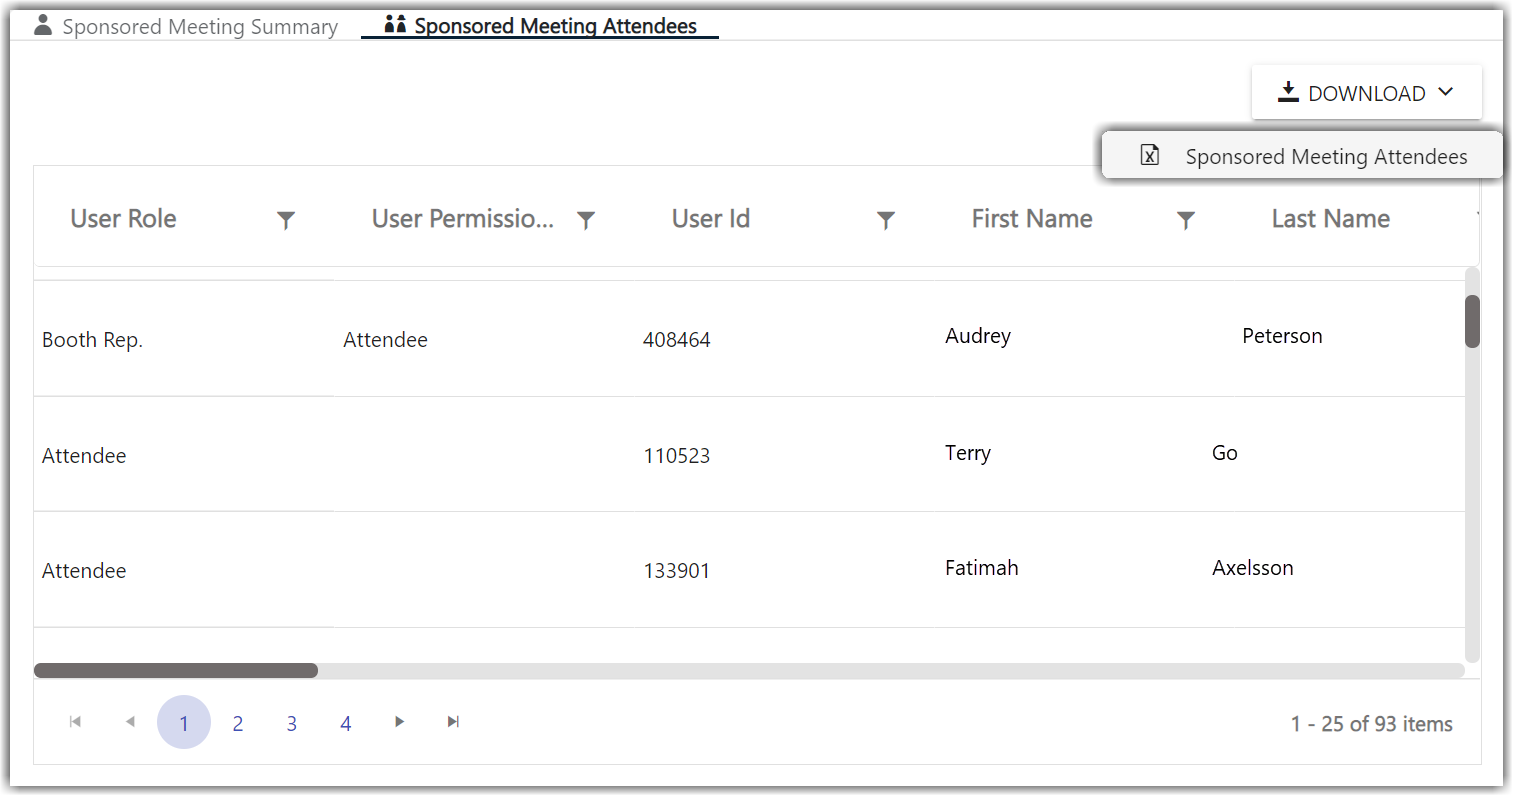
The Meetings report has two different datasets: Summary and Attendees.
The Summary dataset tells you how many meetings are being hosted by the sponsor and includes all meeting information.
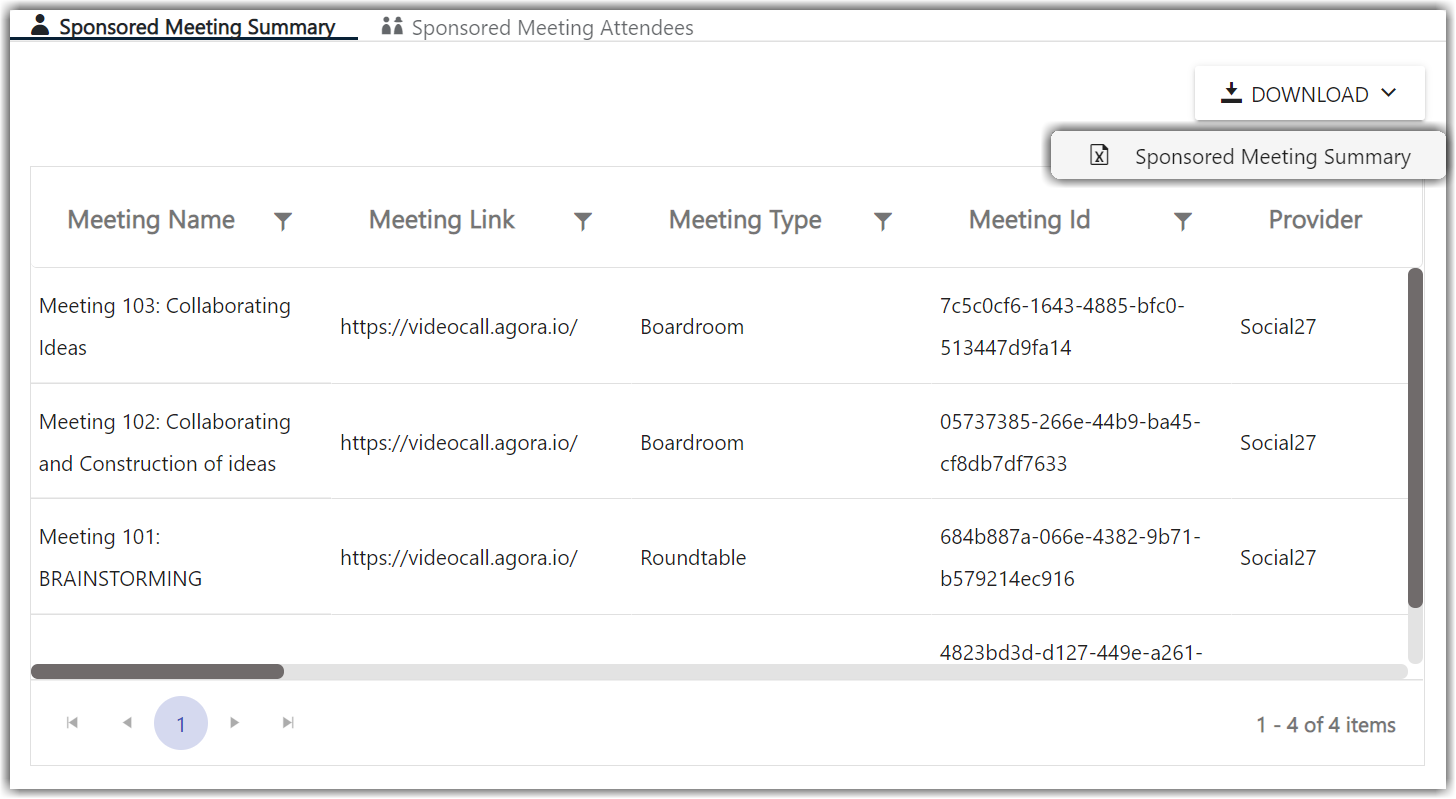
The Attendees dataset tells you which attendees have been invited/joined/launched/observed the each of the sponsored meetings.
How Can I Use This Report?
- Understand which attendees showed interest in your booth and connect with them to deepen the relationship.
![]() Further Reading
Further Reading
Comments
1 comment
This article has been updated to reflect the latest changes to the Sponsor Workspace.
Please sign in to leave a comment.