 |
This article explains how to use the Sponsor Workspace tool. To learn about this functionality in the Events Builder, click here. |
The Dashboard in the Sponsor Workspace gives you the data you need to understand how your microsite. This Dashboard, based on advanced analytics, slice and dice large amounts and varieties of data to highlight key business insights and takeaways, and allow you to accurately assess your virtual events.
This article contains tips for navigating the Dashboard. For a walkthrough of each Dashboard report, check out this article.
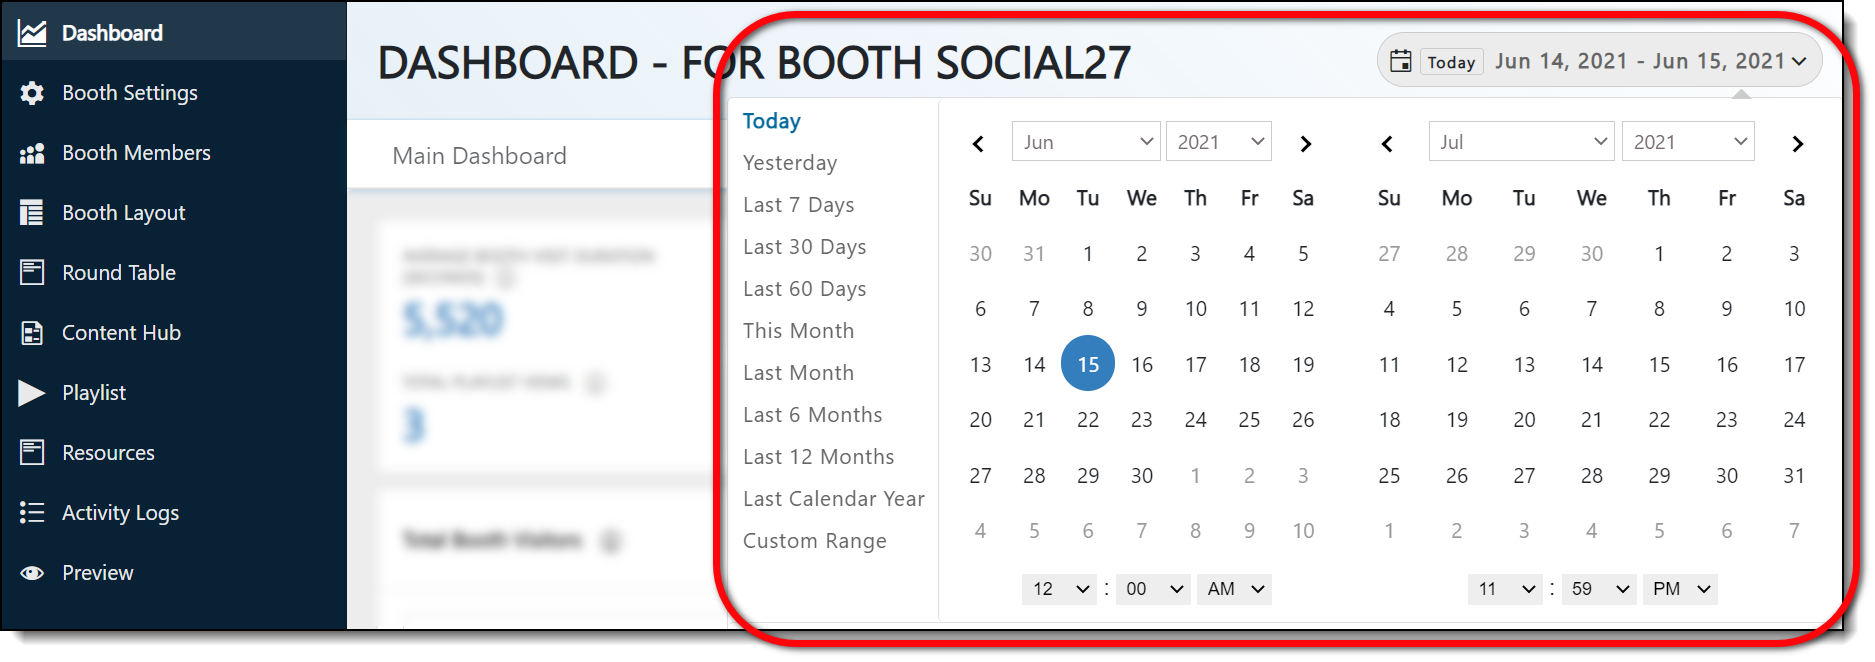
Unless otherwise specified, all data is constrained by the date filter at the top of the page. You can choose from one of the premade filters or create a custom range. The time zone for this date/time filter matches the event's time zone. All times noted in the reports below display in UTC time.

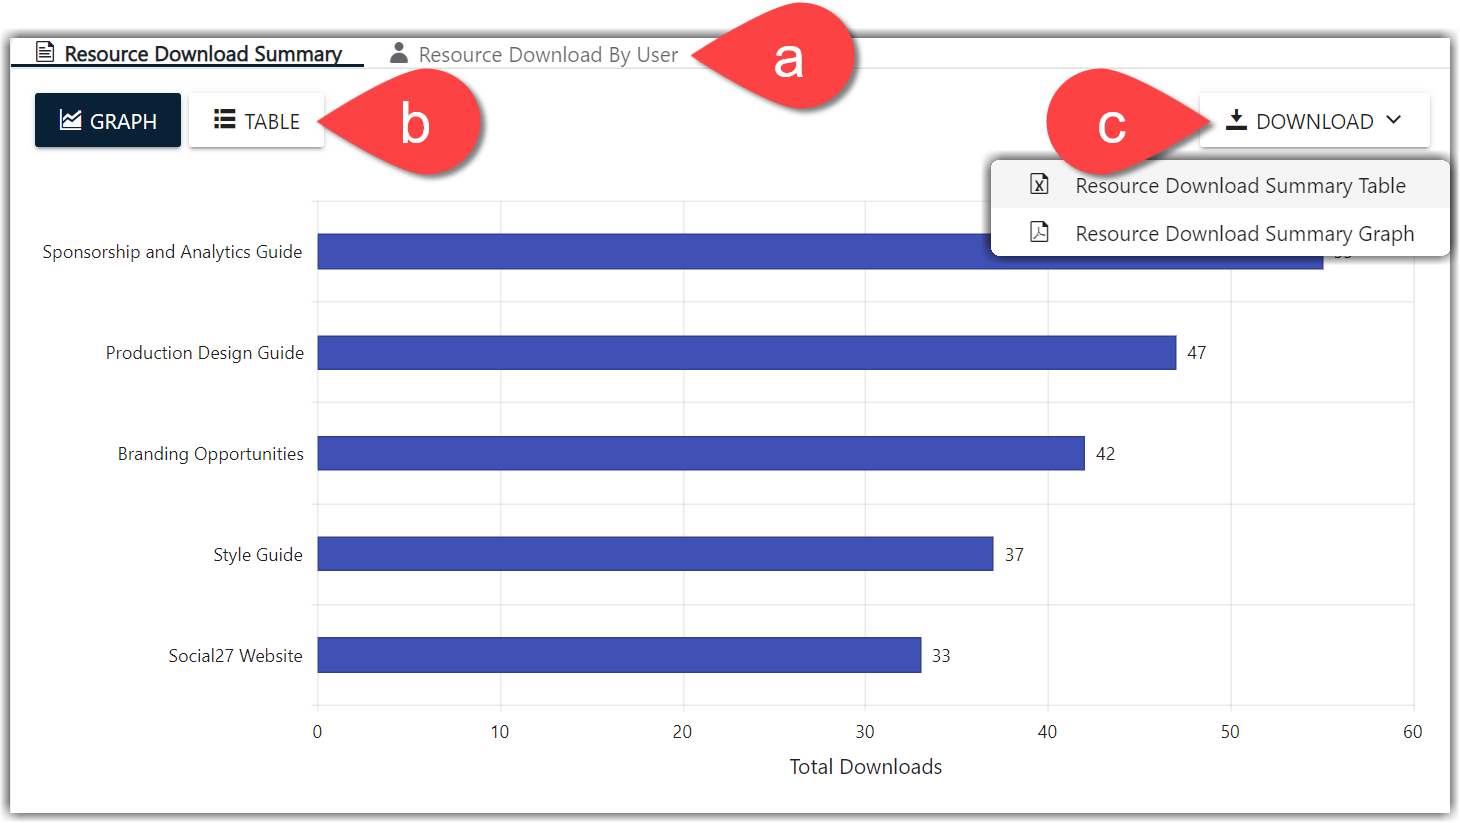
Some reports contain multiple datasets you can alternate between by clicking the tab names at the top of the report (a). You can use the Graph and Table buttons to change how the data is displayed (b), and click the Download dropdown to export the data either to Excel or PDF format.

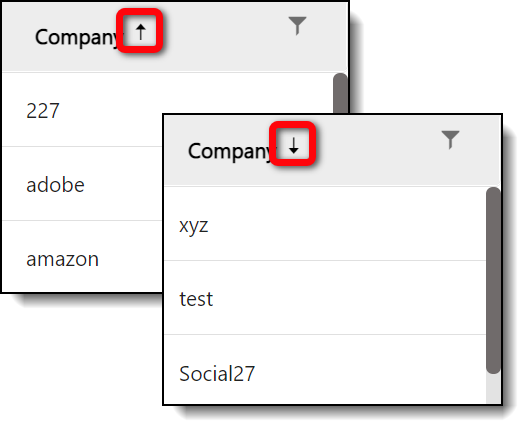
When viewing a report in Table view, click the column header names to sort the table according to that column in either ascending or descending order (alphabetical or numerical).

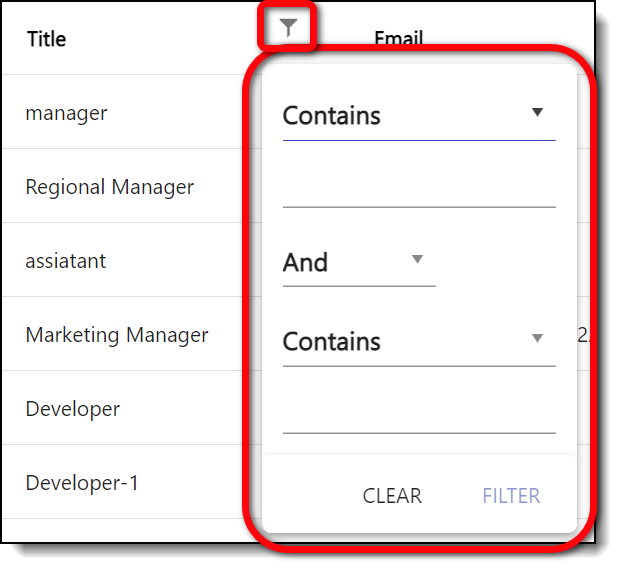
Click the filter icon ![]() that appears to the right of each column name to filter data out of the report.
that appears to the right of each column name to filter data out of the report.

Use the page number buttons that appear the bottom of each report to navigate through your data.

![]() Further Reading:
Further Reading:
Comments
1 comment
This article has been updated to reflect the latest changes to the Sponsor Workspace.
Please sign in to leave a comment.