 |
This article explains how to use the Sponsor Workspace tool. To learn about this functionality in the Events Builder, click here. |
There are several different reports you can use to find out which visitors have interacted the most with your booth content, depending on content type:
To access these reports, log in to the Sponsor Workspace and select your event. Select the booth you want to view data for and click Dashboard in the left navigation menu. Use the jump menu to navigate directly to the report you're interested in. (For more Dashboard navigation tips, check out this article.)

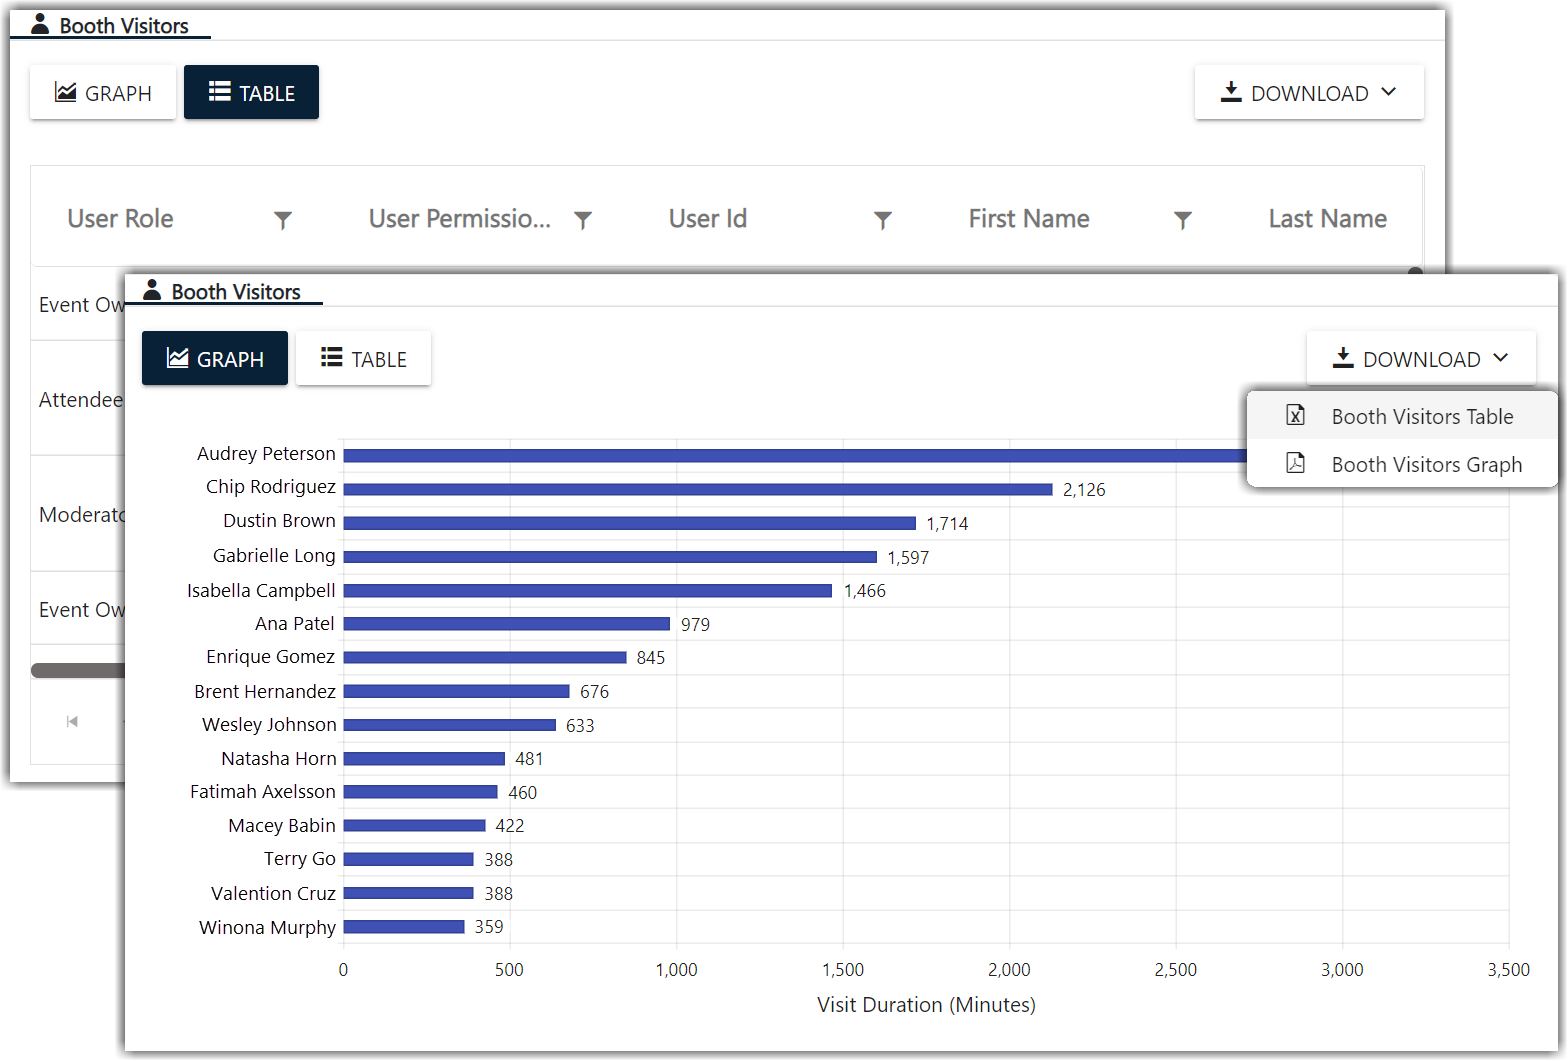
Booth Visitors
To see your top five visitors overall, check out the Booth Visitors report. Graph view shows you the total visit duration for all visits for each attendee , and Table view shows you average visit duration and the number of times each attendee visited.
Playlist
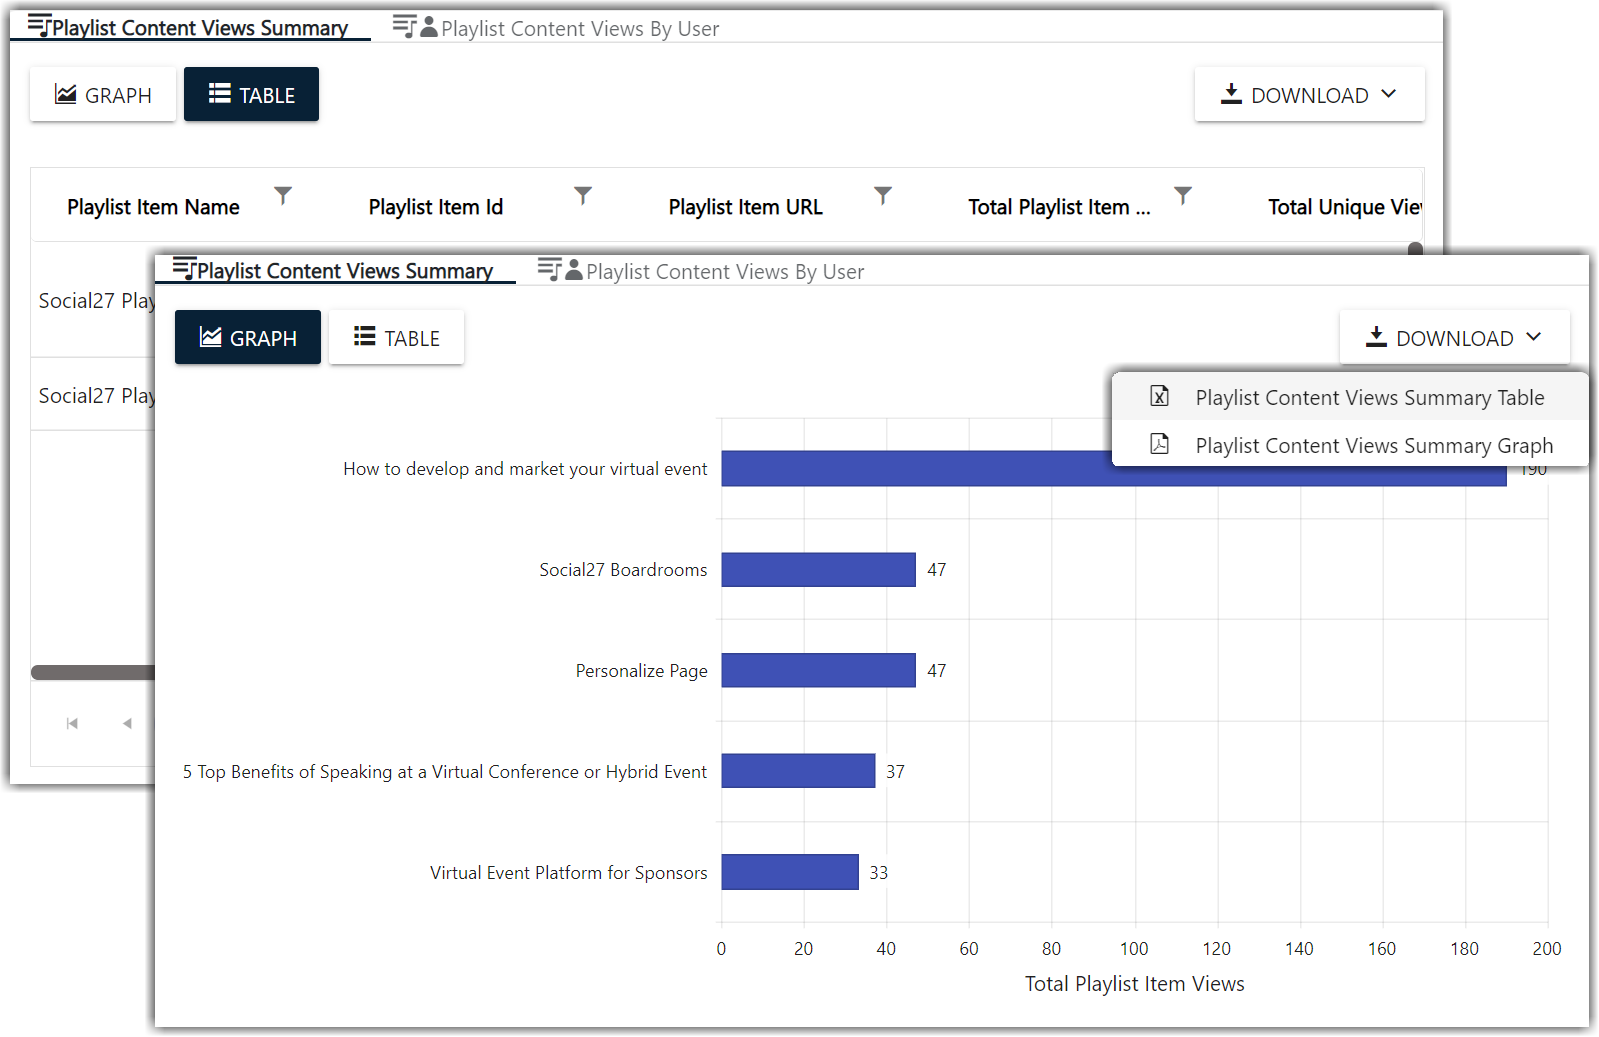
The Playlist report has two different datasets: Summary and By User.
The Summary dataset tells you how many times each item Playlist item has been viewed.
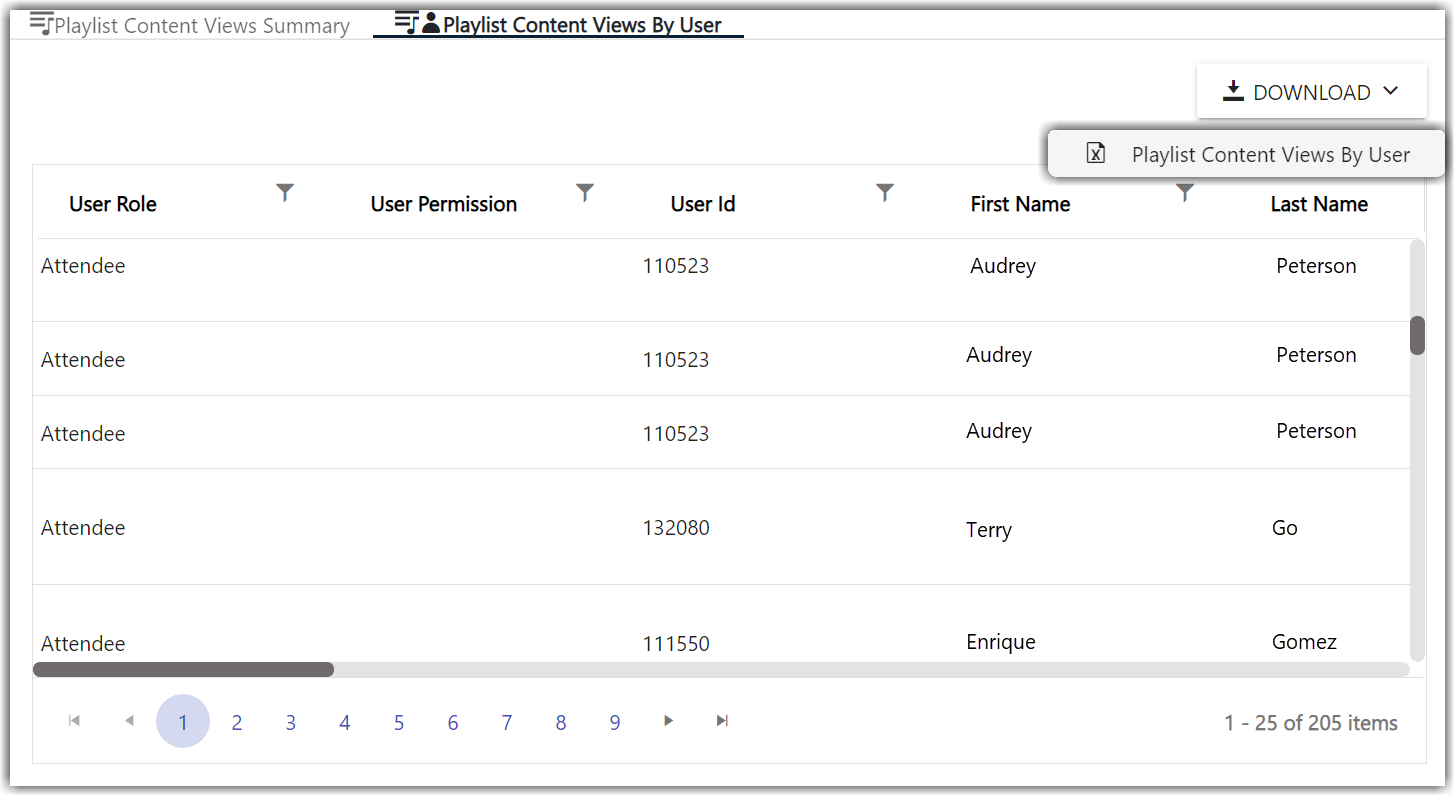
The By User dataset tells you which attendees have viewed each Playlist item (available only in Table format).
Resources
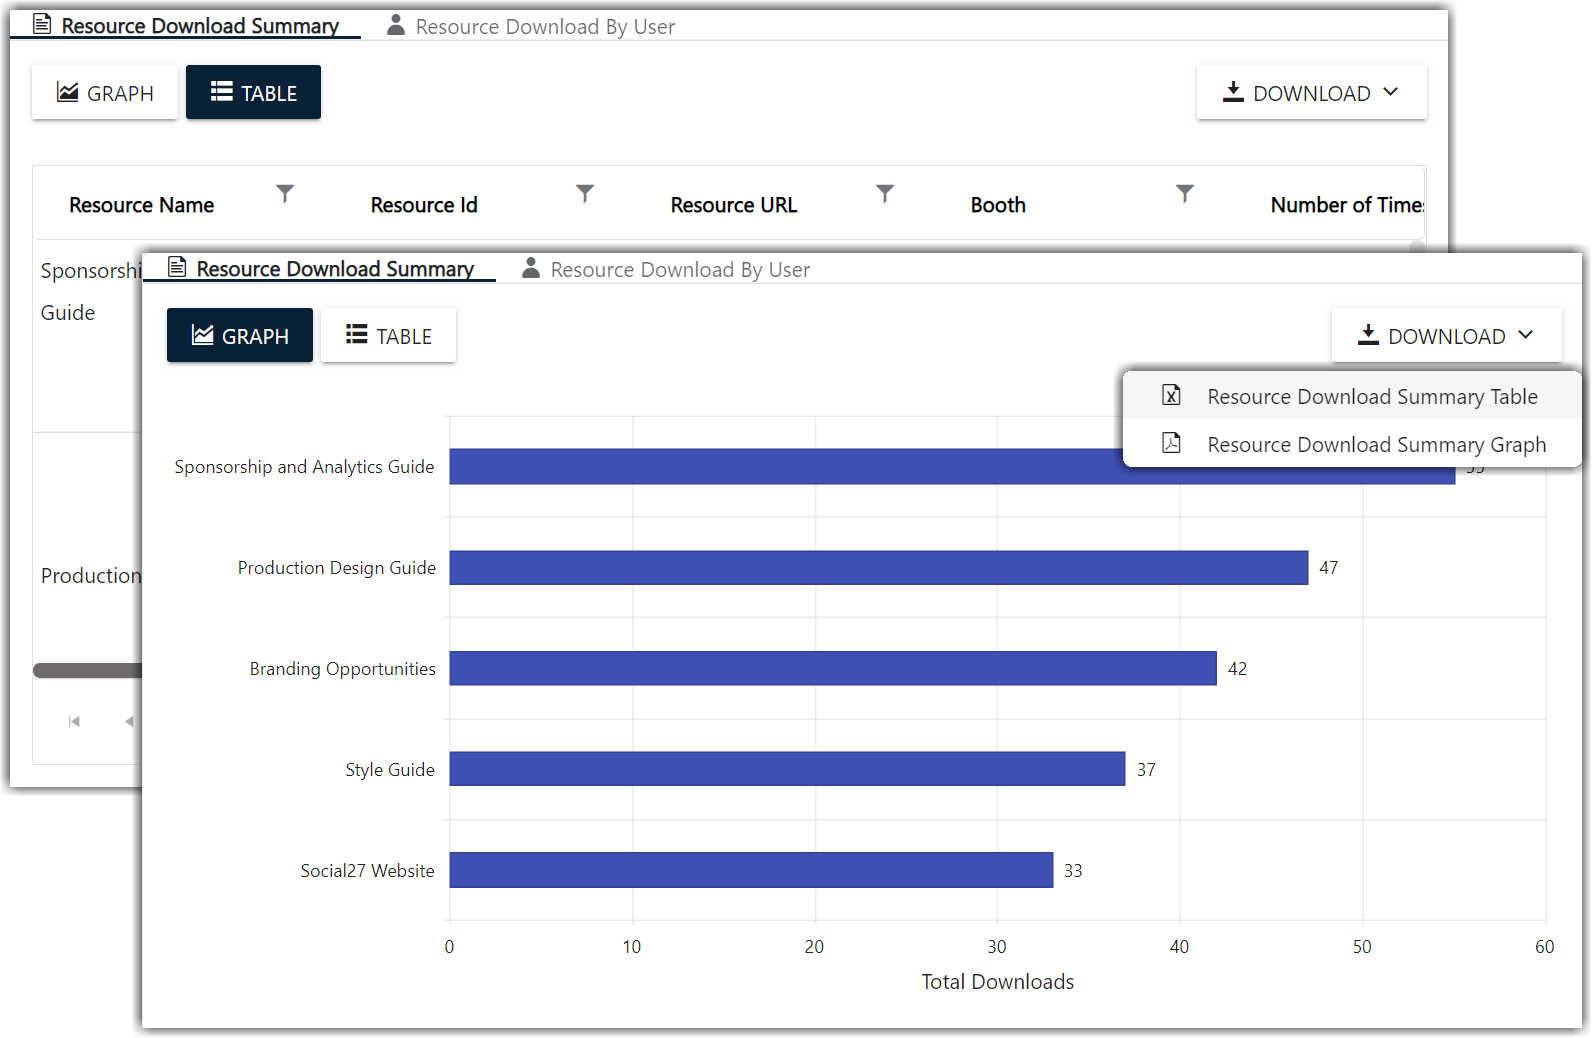
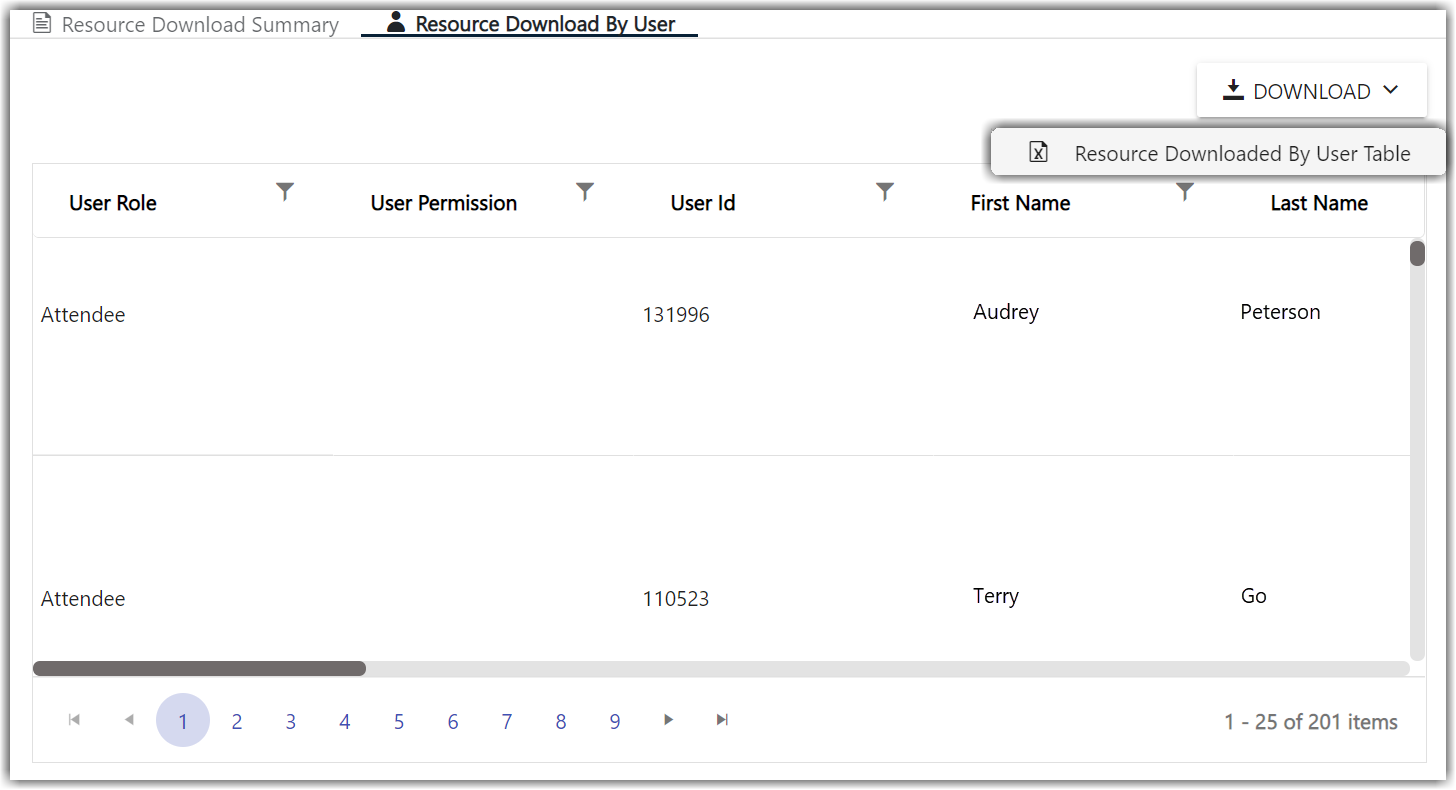
The Resources report has two different datasets: Summary and By User.
The Summary dataset tells you how many times each resource has been downloaded.
The By User dataset tells you which attendees have downloaded each resource (available only in Table format).
![]() Further Reading
Further Reading
Comments
1 comment
This article has been updated to reflect the latest changes to the Sponsor Workspace.
Please sign in to leave a comment.