 |
This article explains how to use the Events Builder tool. To learn about this functionality in the Sponsor Workspace, click here. |
Social27’s Analytics Dashboards give you the data you need to understand how your virtual event is performing on the Social27 platform. These Dashboards, based on advanced analytics, slice and dice large amounts and varieties of data to highlight key business insights and takeaways, and allow you to accurately assess your virtual events.
This article covers the following topics:
Analytics Tabs
Social27 reports can be accessed by logging in to the Events Builder and clicking Analytics in the left navigation panel. Reports appear on various ”Dashboards” that can be accessed using the tabs that run across the top of the screen.

Once you’ve navigated to a tab, use the lower jump menu to navigate directly to a specific report.

Unless otherwise specified, all data is constrained by the date filter at the top of the page. You can choose from one of the premade filters or create a custom range. The time zone for this date/time filter matches the event's time zone in General Settings. All times noted in the reports below display in UTC time.

The following tabs are available in Social27 Analytics. For a complete list of all reports and all data points considered for each report, check out this spreadsheet, which is updated regularly to match the available reports.
- Dashboard: Gives a quick overview of the event, presenting information about registration, attendance, user activity, and user connections.
- Users: Houses all reports about your users, including registration information, time-based activity reports, and connections.
- Sessions: Helps you understand how your users are participating in sessions by providing information about session attendance, session chats, and session resource downloads.
- Sponsors: Tells you which users are visiting which booths, as well as how users are interacting within sponsor booths with Playlist and resource content, chats, and connections with booth staff.
- Gamification: Shows you how users are participating in the gamification aspects of the Social27 platform, including the number of badges and points they are achieving.
- Roundtables: Displays how attendees are participating in Social27’s meetings, called Roundtables and Boardrooms, including how many meetings are being scheduled, their attendance, and duration.
- Engagement: Provides information about how users are engaging in your event, including if they are indicating Areas of Interest (AOI); uploading Hello World! or Soapbox videos; and responding to polls, surveys, and quizzes.
- Others: Includes a collection of miscellaneous reports about CEU, payment, posters, and user actions.
Navigation Tips
Mouse over the ![]() icons that appear beside many of the report names and field labels to reveal a tool tip that explains which data that metric examines:
icons that appear beside many of the report names and field labels to reveal a tool tip that explains which data that metric examines:

Some reports contain a toggle in the upper right corner that allows you to switch between graph and list views of the report.
![]()
Most Dashboard reports can be viewed both within the Social27 Analytics Dashboard and downloaded to Microsoft Excel for further analysis. Click the Download button that appears in the top right corner of each report to download the data to your computer. If you are viewing the data in list view, an Excel file will download, and if you are viewing the data in graph view, a PDF file will download.

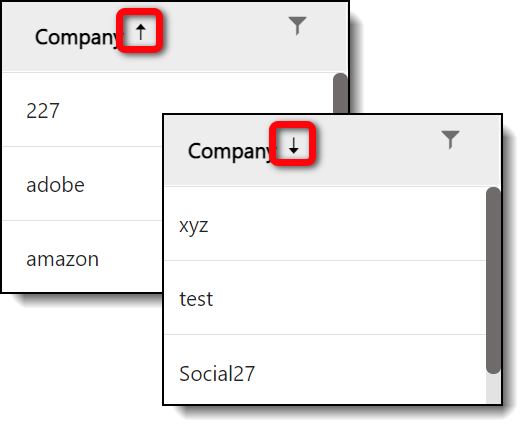
When viewing a report in list view, click the column header names to sort the entire list according to that column in either ascending or descending order (alphabetical or numerical).

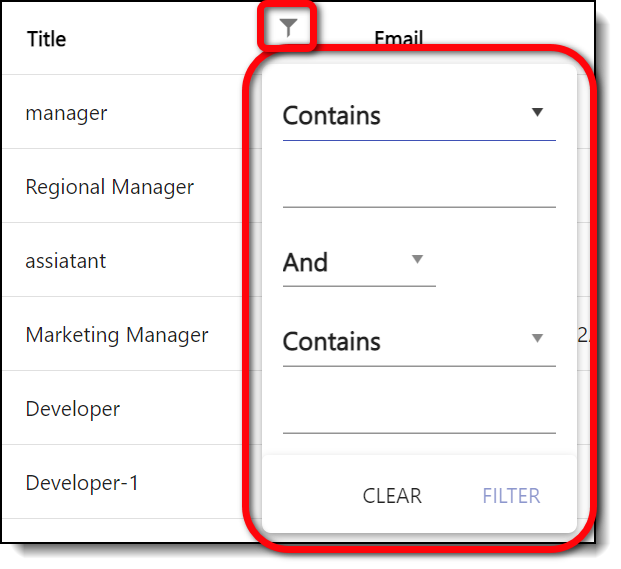
Click the filter icon ![]() that appears to the right of each column name to filter data out of the report.
that appears to the right of each column name to filter data out of the report.

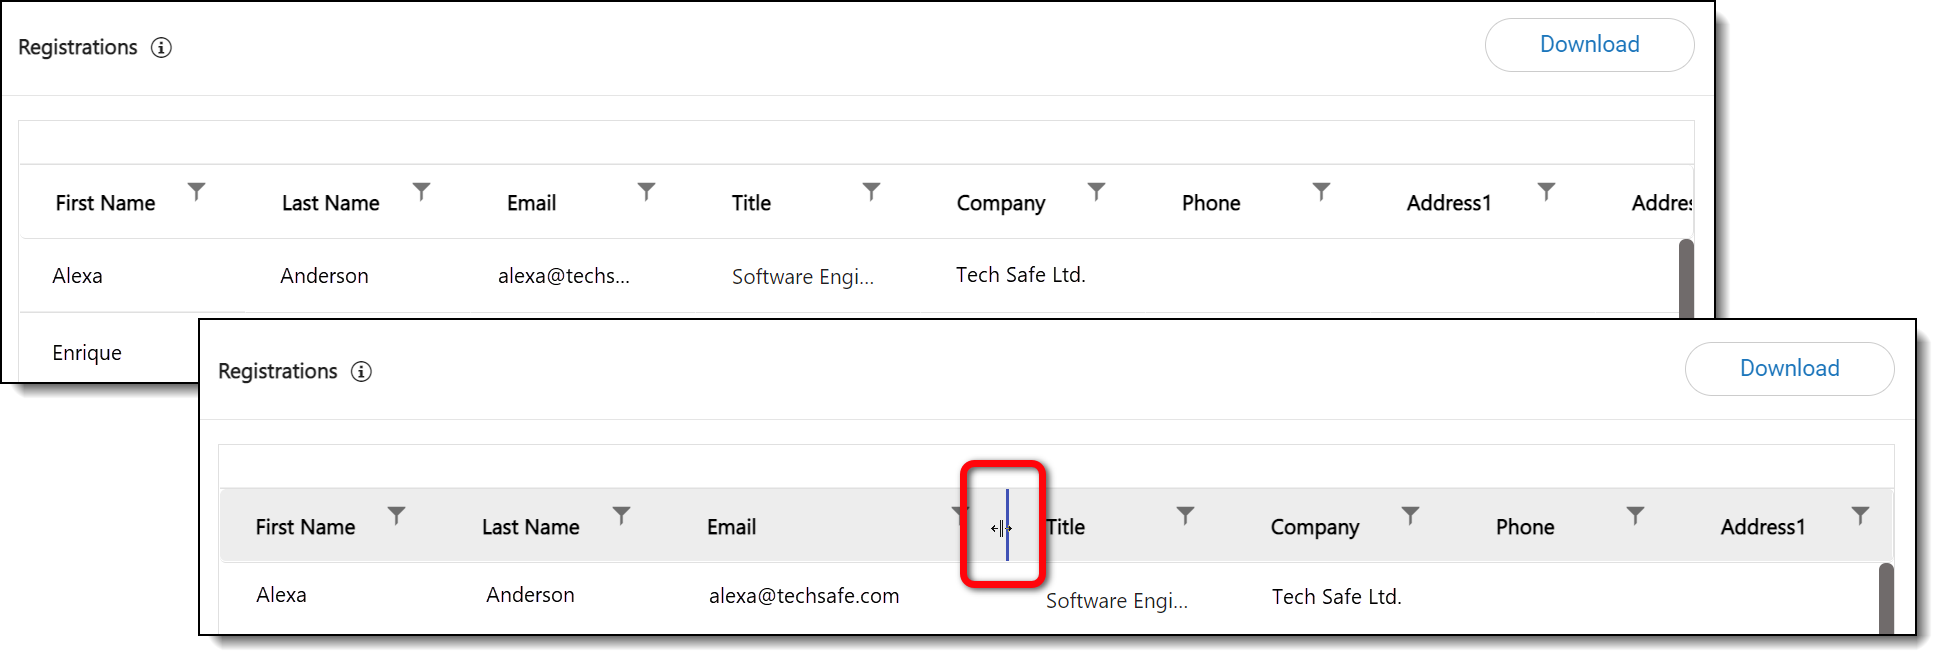
To change column widths, hover over the space after the filter icon until a vertical blue line appears and the cursor changes into a split cursor: ![]() . Click and drag the column to widen or shrink it.
. Click and drag the column to widen or shrink it.

Use the page number buttons that appear the bottom of each report to navigate through your data.

![]() Further Reading: Check out the rest of Social27’s Reporting articles.
Further Reading: Check out the rest of Social27’s Reporting articles.
Comments
0 comments
Please sign in to leave a comment.