The Social27 Analytics Users Dashboard gives you the data you need to understand how your users are interacting on the Social27 platform. The reports on this Dashboard will allow you to:
- Understand user registration, attendance, and time spent in your event
- Identify which sessions and pages users are visiting
- Quantify networking among users
To access the Users Dashboard, log in to the Events Builder and use the left navigation panel to navigate to Analytics, then click the Users tab. Use the lower jump menu to navigate directly to a specific report. Don’t forget to set the date range in the top right corner of the screen. Use the Download buttons if you wish to download the reports from the Users Dashboard. For a full list of all fields that appear in the Users reports, check out this spreadsheet.
 _
_
The Users Dashboard includes the following reports:
- Registrations
- Users Logged In / Not Logged In
- User Activity
- Event Attendees By Hours
- Day Wise First In Last Out
- User Connections
- Button Clicks
- Event Click Summary
Registrations
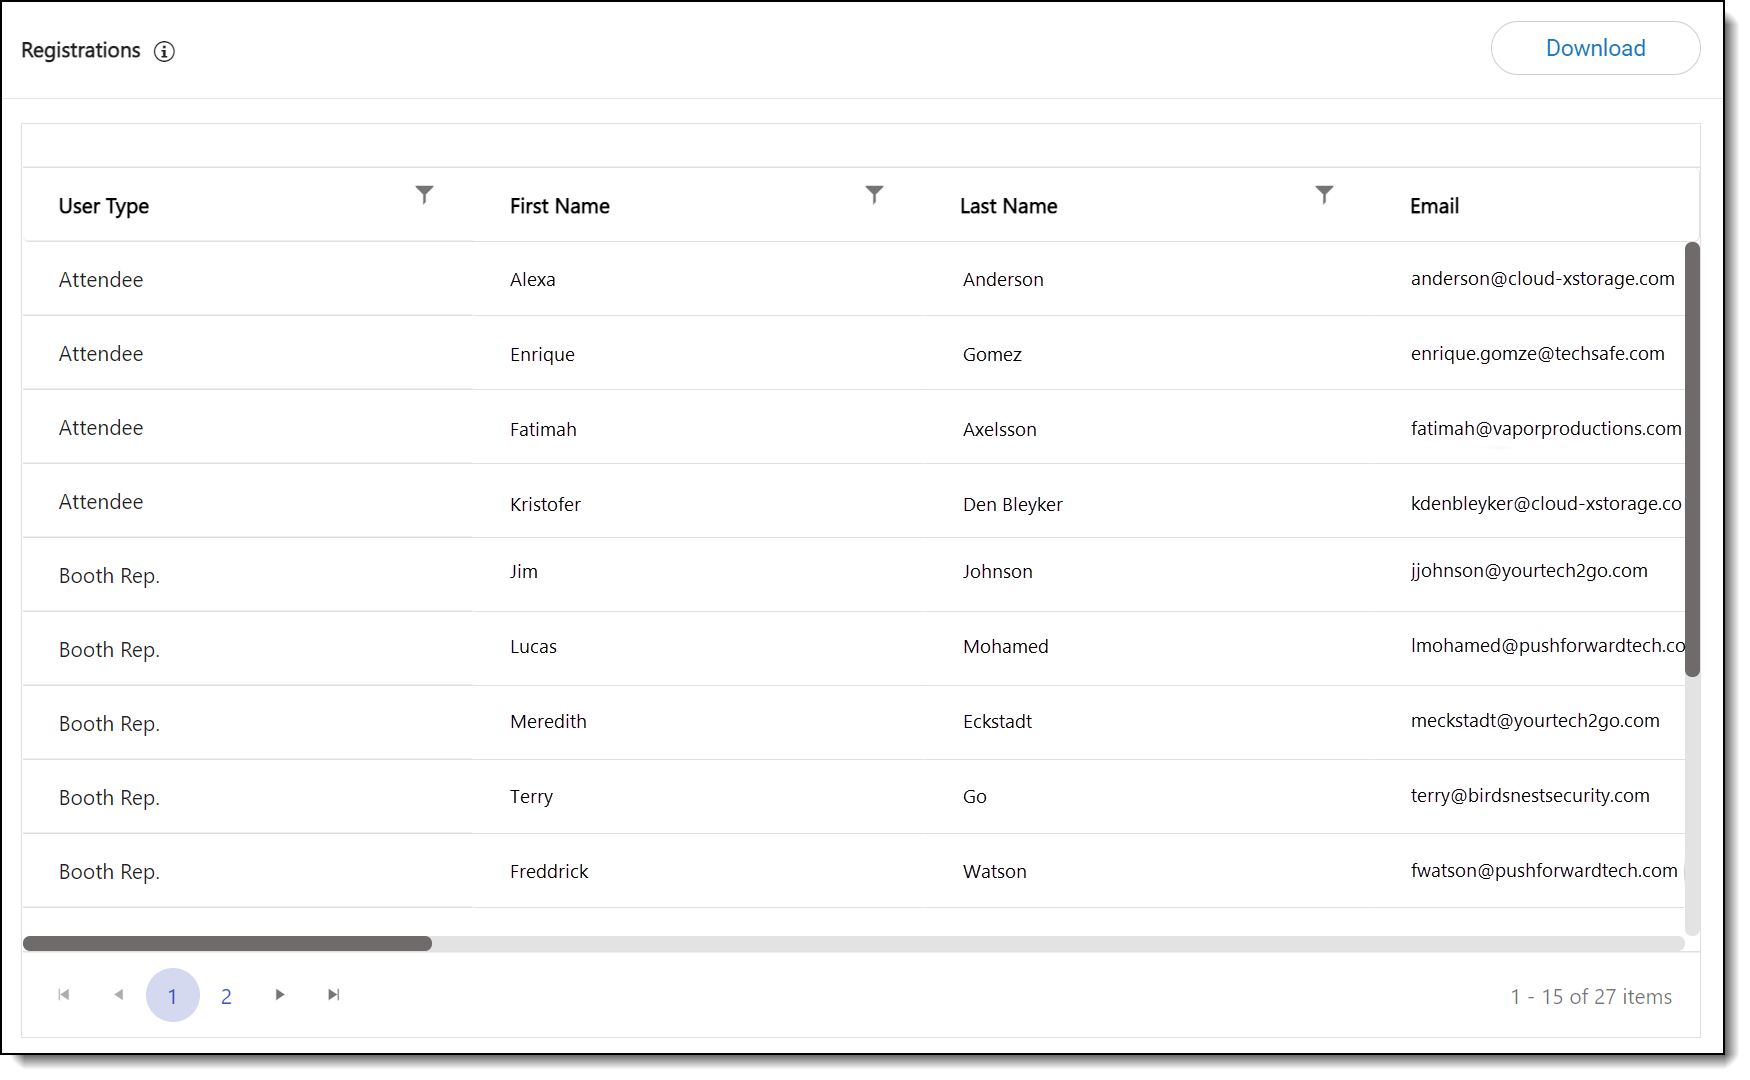
The Registrations report shows you all information each user provided at the time of registration, including name, email, title, department, company, phone, address, city, state/province, and region. You can also see the time and date of each user’s registration in this report.
A user is considered “Registered” when their registration information is imported into Social27. Note that if you are using an API or bulk uploading your registrations, your metrics may not reflect when the attendees themselves registered. Contact your CSM about setting up registration for your event.
If your registration form includes custom fields, these will display on the far right of the report. You may also see a UTM field that can be used for tracking how your user accessed registration. Contact your CSM for more details.
How Can I Use This Report?
- Find contact information for a specific registered user.
- Sort the data by user type, title, company, or location to understand your event’s attendee demographics.
- View how many users have registered for your event and gain an idea of potential attendance numbers.
- View responses to all questions in your Social27 Registration (note that this may be different than your source data if you are importing users using a different method other than Social27 Registration forms).
Users Logged In / Not Logged In
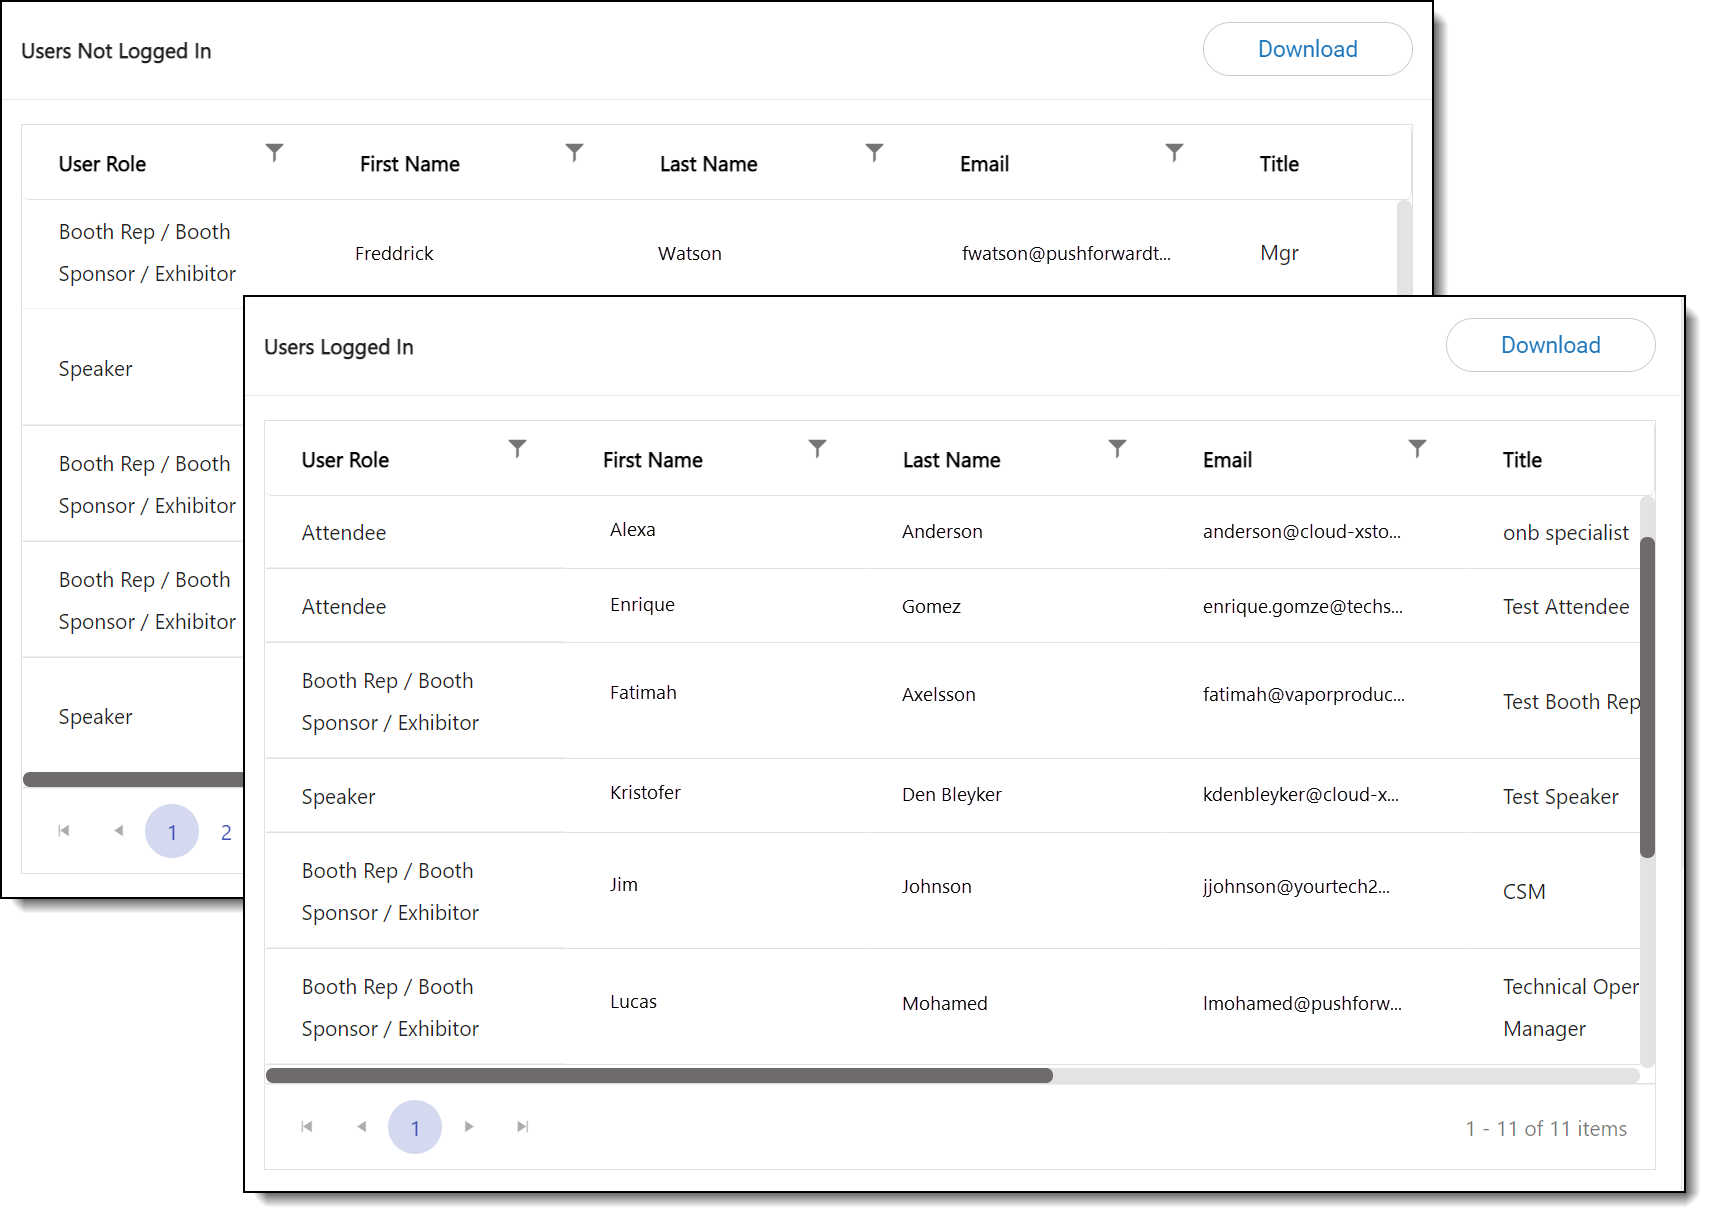
These two reports give you a list of users who have and have not logged in to the event. The Users Logged In report also displays the last login time for each user, as well as the duration of their event visit (in minutes). Both of these reports can be viewed in the Dashboard and downloaded to Excel.
A user is considered Logged In if they have any activity on the site in the selected date range, including logging in. So an attendee will be considered Logged In on May 11 if they logged in on the night of the May 10 but were still active on May 11. An attendee who only logged in, and took no other action will still be considered Logged In. Users Not Logged In displays all other users.
How Can I Use This Report?
- The User Not Logged In report is your primary list of emails to reach out to in order to drive next-day attendance.
- View which users are currently logged in and engage with them via the Networking Lounge.
User Activity
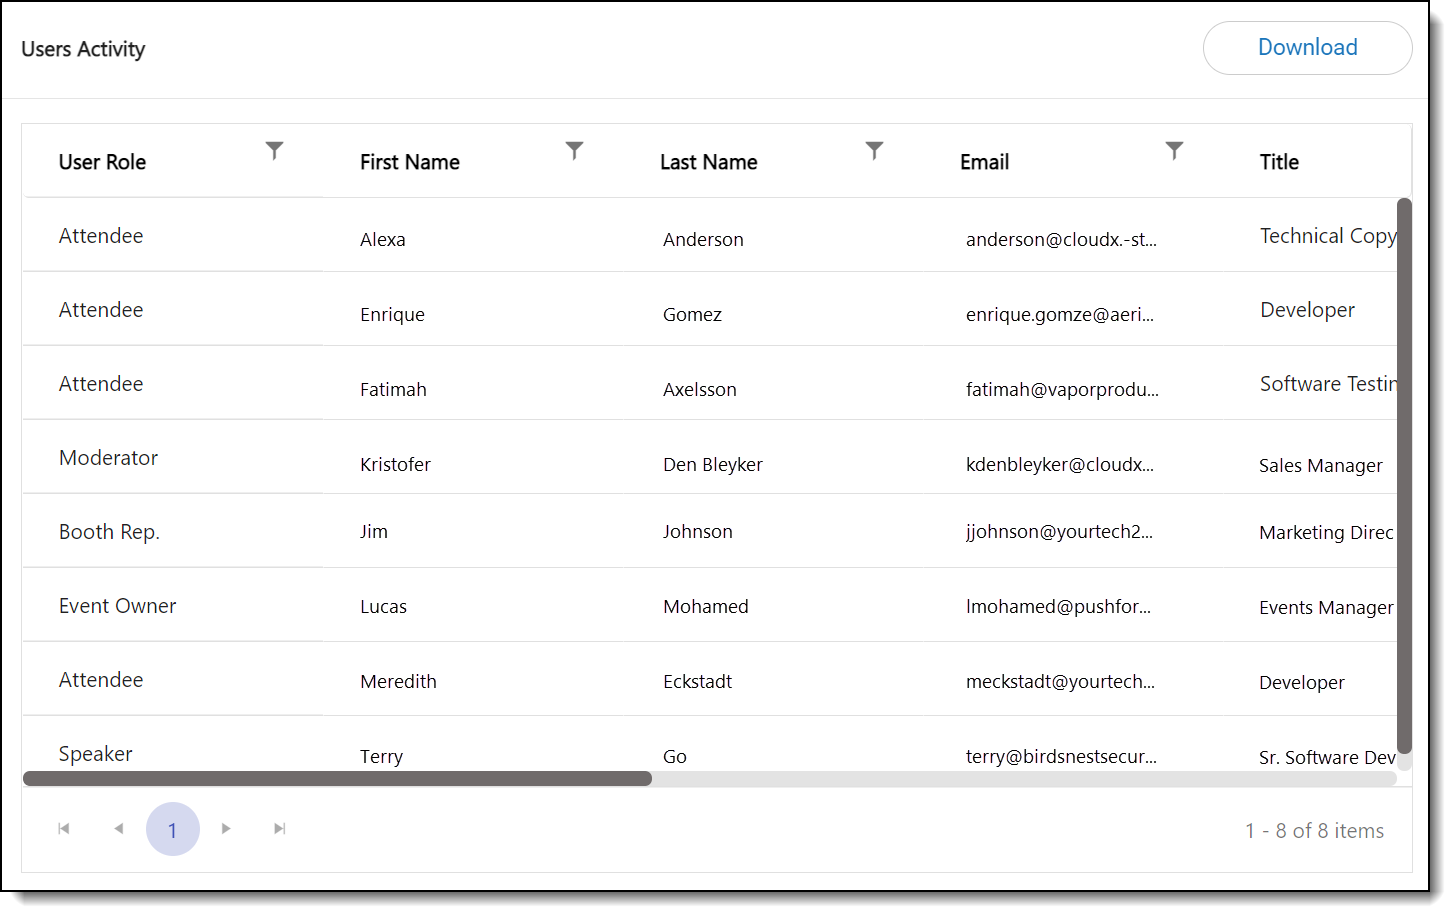
The User Activity report helps you understand if your users have attended/viewed Sponsor Booths, Home Page, Happy hour, or Session. These are summary statistics: to discover specific user actions, select the Sessions, Sponsors, or Engagement tabs at the top of the page as needed.
How Can I Use This Report?
- If you see low activity, set up a notification or send an email to remind attendees about your sessions and Happy Hours.
- Remind attendees of the Add to Calendar options for sessions to increase attendance.
Event Attendees By Hours
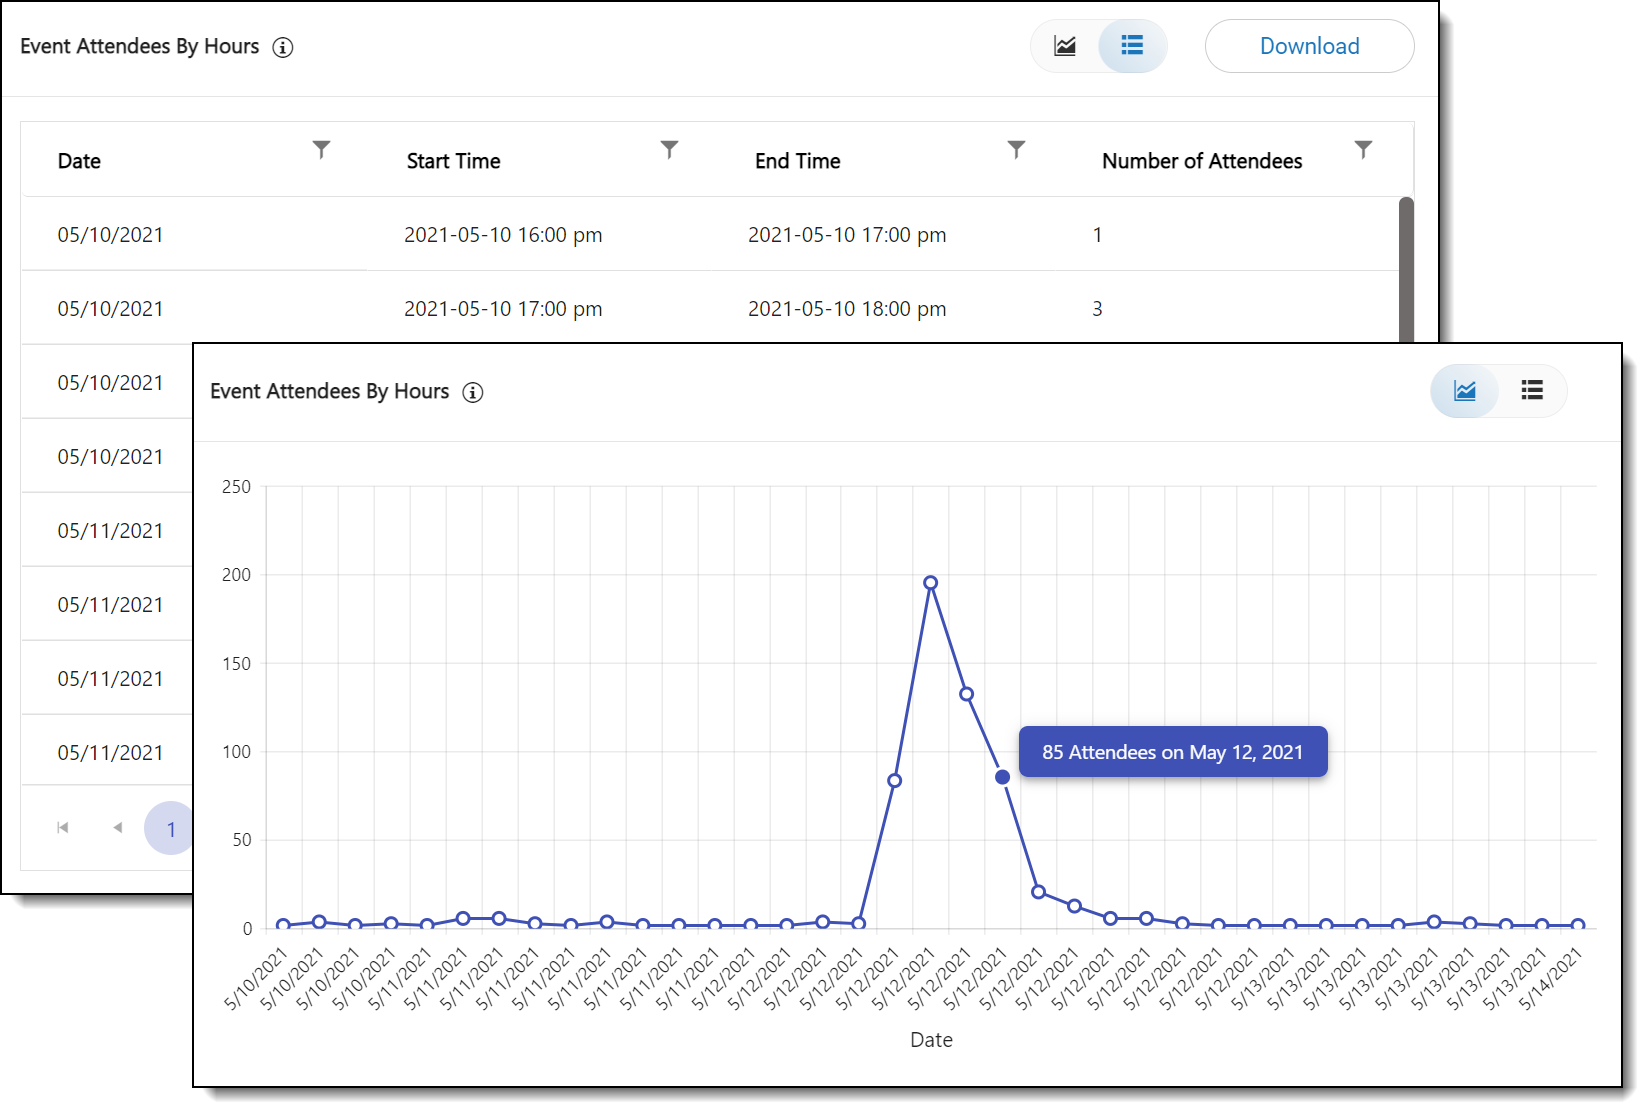
This report displays how many attendees were active in the event each hour. Because the report can only display a maximum of 40 days of data, make sure that the date filter at the top of the page is set to less than 40 days. Hovering over data points on the graph view will reveal the number of attendees for that date.

This report is an estimate of the number of attendees who are on the site at a given time based on whether or not there is action recorded for that user at that time. Because this report shows an estimate, it may not perfectly represent all active attendees, such as attendees who are passively watching sessions but not actively engaged. However, this report is an accurate representation of the comparison of traffic between different times and is can be used to understand attendee behavior over time.
How Can I Use This Report?
- Let your sponsors know which hours attendees are most actively participating so they can better engage with them.
- Review the sessions, meetings, and Happy Hours that took place during peak and low activity hours to understand which features are most interesting to attendees.
Day Wise First In Last Out
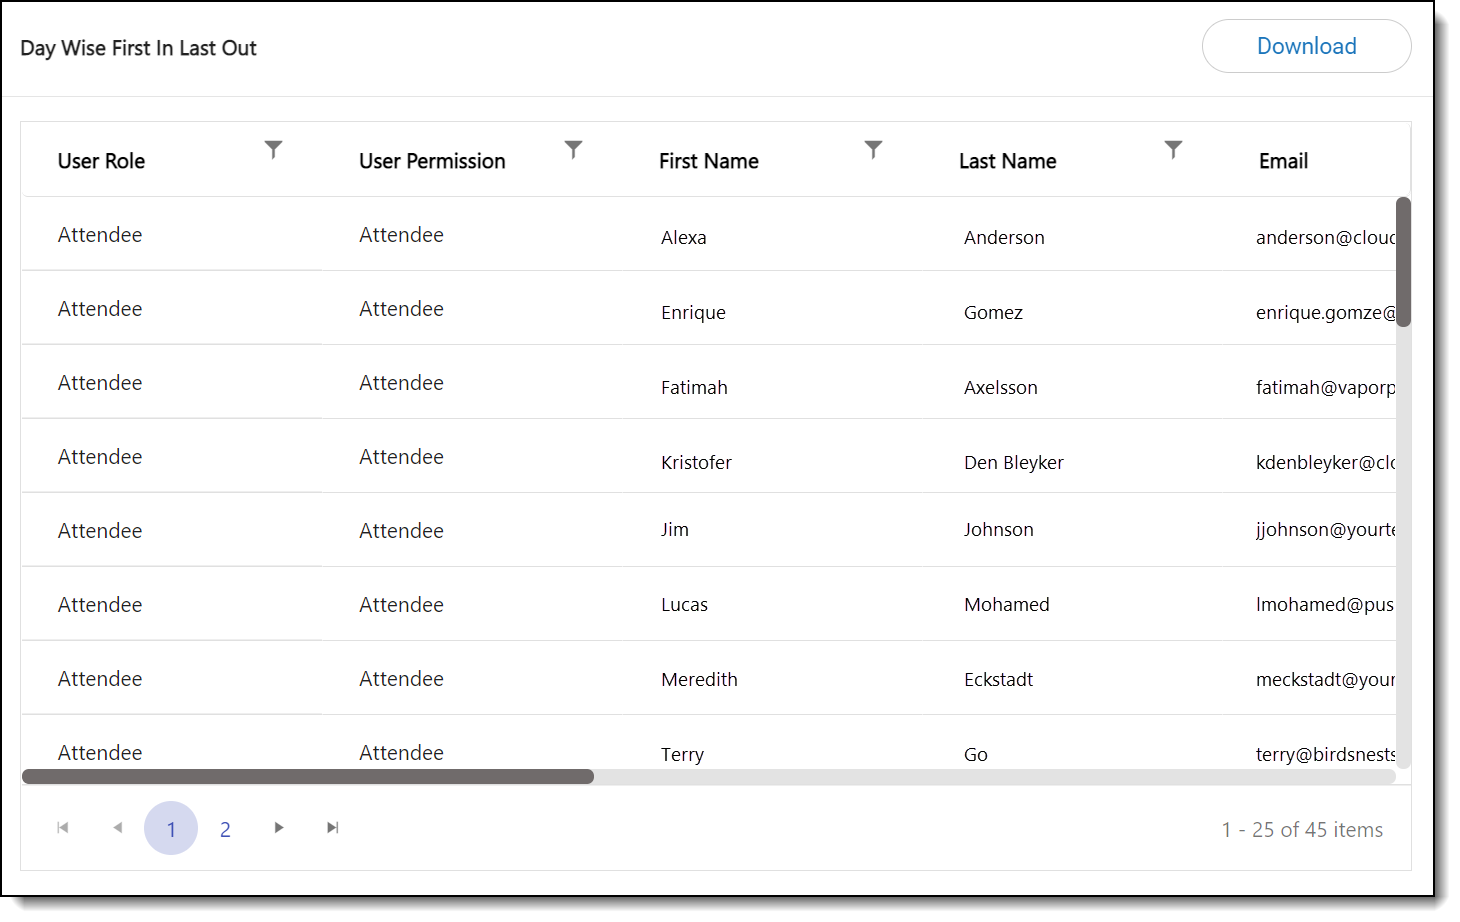
This report gives a daily summary of the first and last activity time for each attendee who participated in the event. (Logging in or out is considered an activity.)
Note that if an attendee logs in first thing in the morning, and logs out during the last portion of the day, the report will display that timeline. This does not imply that the attendee was active during the entire time. The Total Time in Event field in this report gives an estimate of the amount of time the attendee was actually active during the specified period.
How Can I Use This Report?
- Study time trends of when your attendees are logging in and logging out of the event.
- Understand if there are particular trends for when your attendees log in or out based on other activities on the site.
User Connections
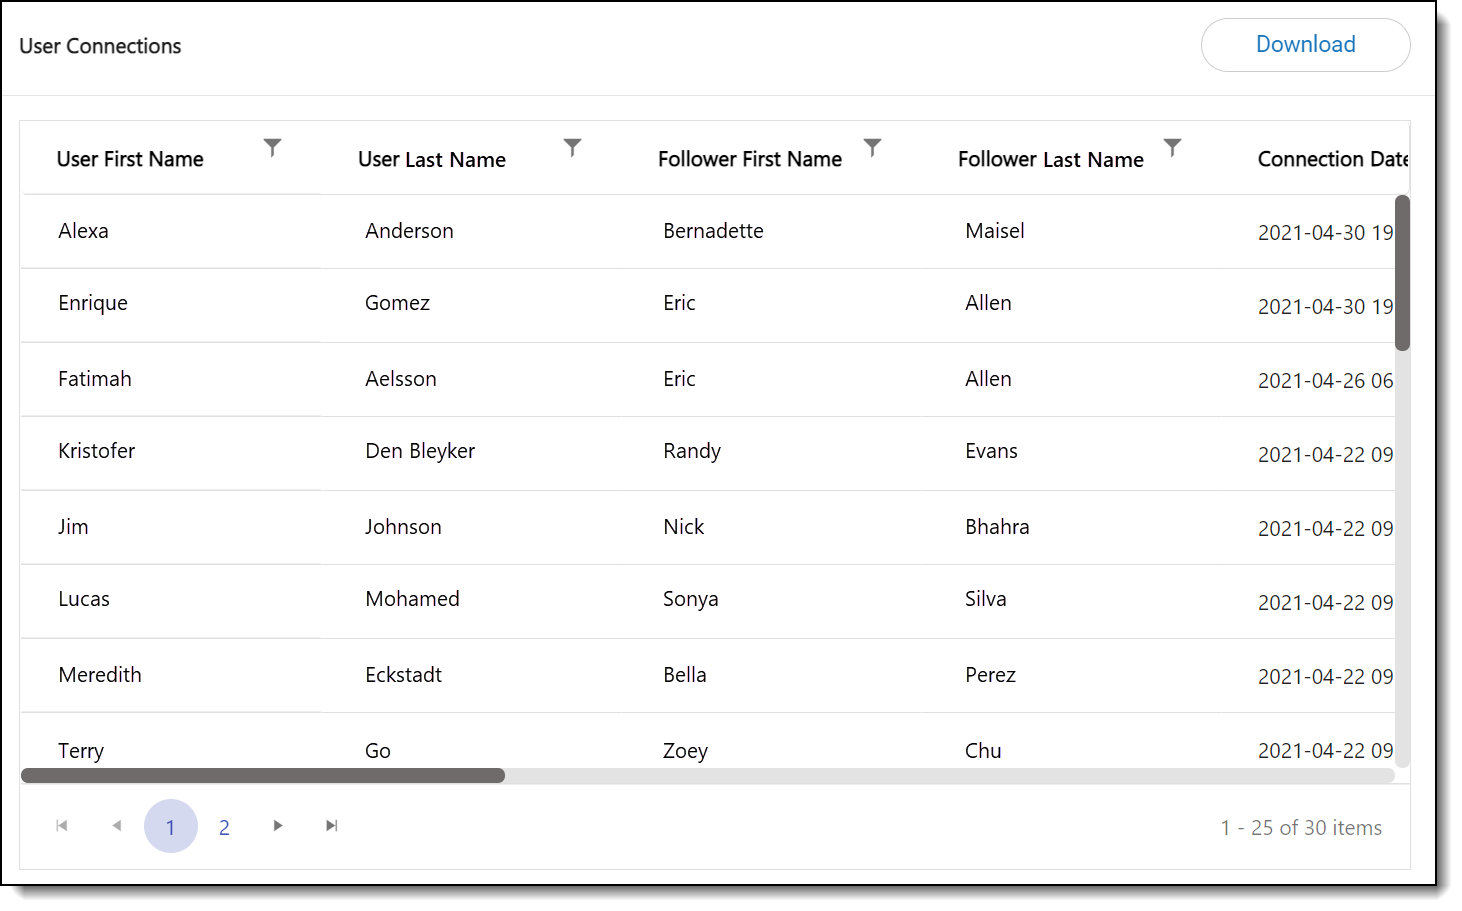
This report lists all connections that were made throughout the event. Connections are made whenever a Connect button is clicked. The Connect button appears on user profiles in sponsor pages, in Roundtables and Boardrooms, in chats and in the Networking Lounge.
Note that the Sponsors tab also includes a similar report, Sponsor Booth Staff Connection Log, that only displays connections between booth staff members and users. If your sponsors have access to the Sponsor Workspace, they will also see this Sponsor Booth Staff Connection Log report, but their version only includes connections made by members of their specific booth staff.
How Can I Use This Report?
- Discover which users were most active in connecting with one another and consider reaching out to thank them for their event participation.
- Learn more about the types of relationships that were fostered during your event.
Button Clicks
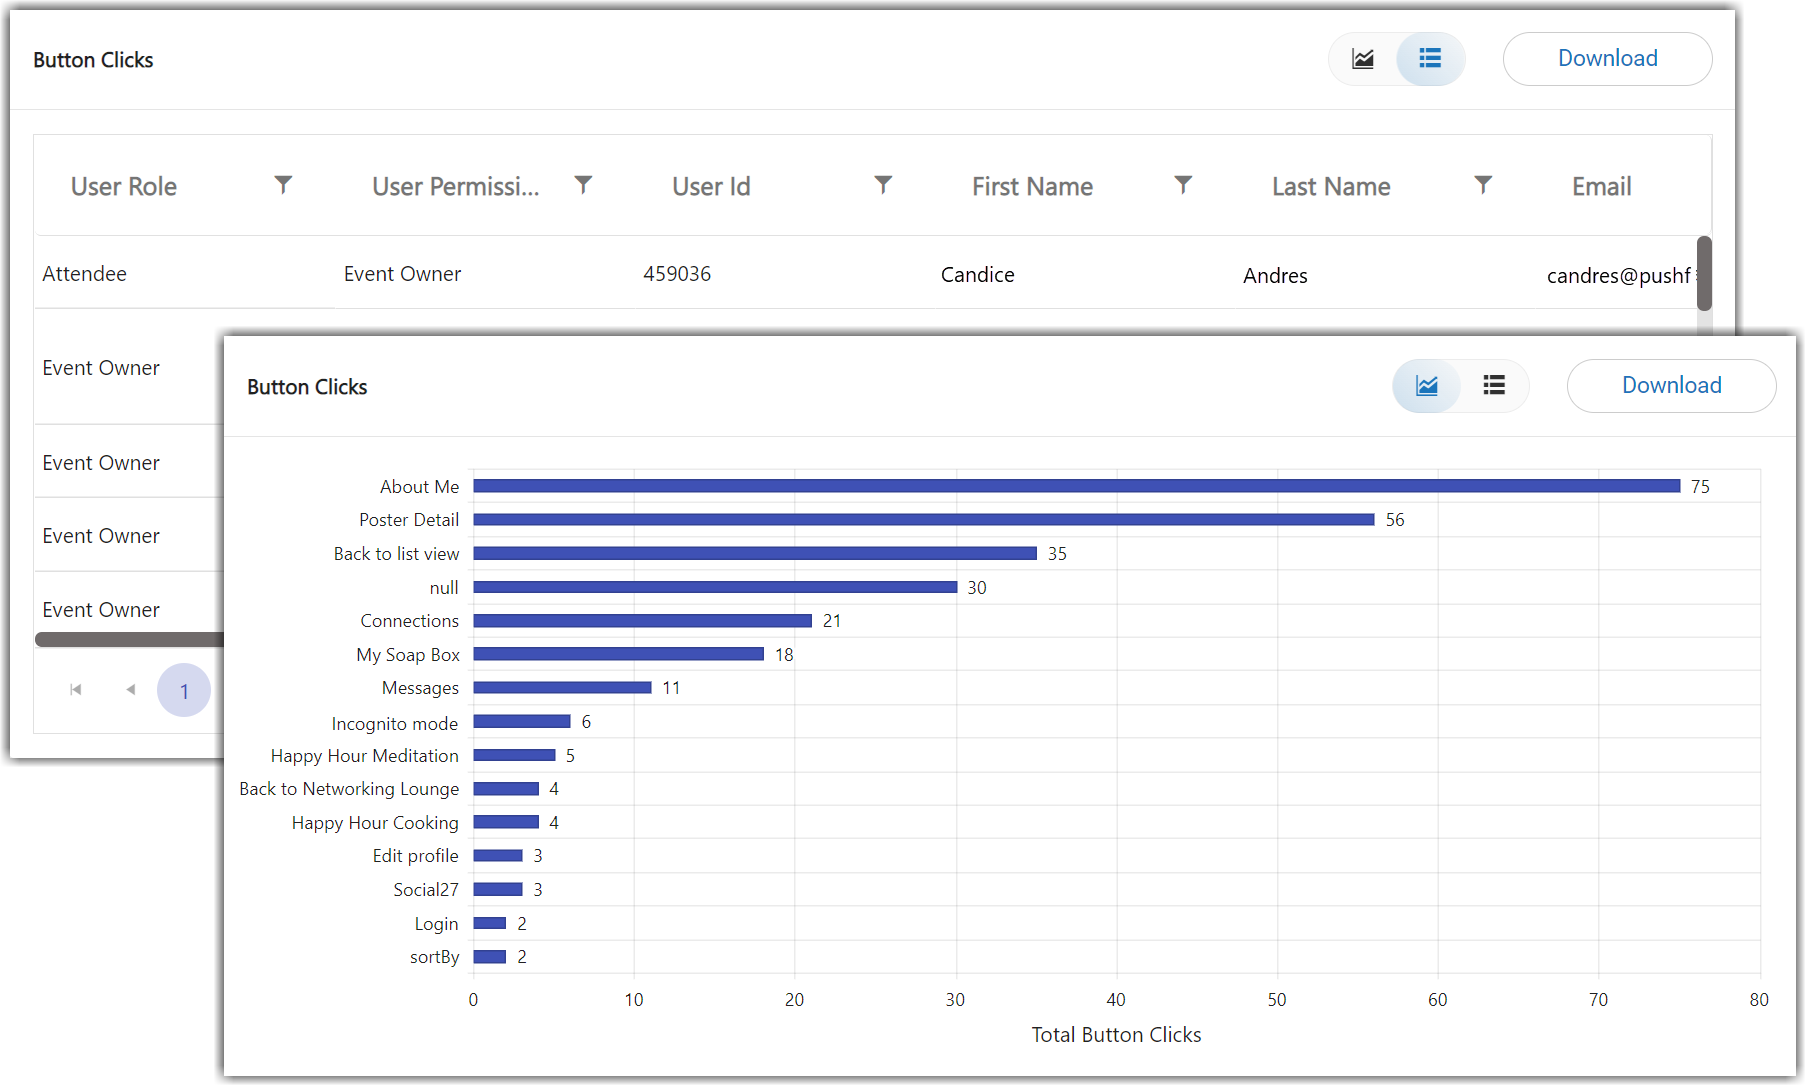
This report contains a record of every time a user clicks a button that directs them from one URL to another. The date/time of the click, as well as the originating URL (the page the button appears on) and the target URL (the page the button directs the user to). If a user clicks the same button multiple times, each click will be recorded as a separate row in this report.
How Can I Use This Report?
- Discover which pages users are being directed to from within the event site.
Event Click Summary
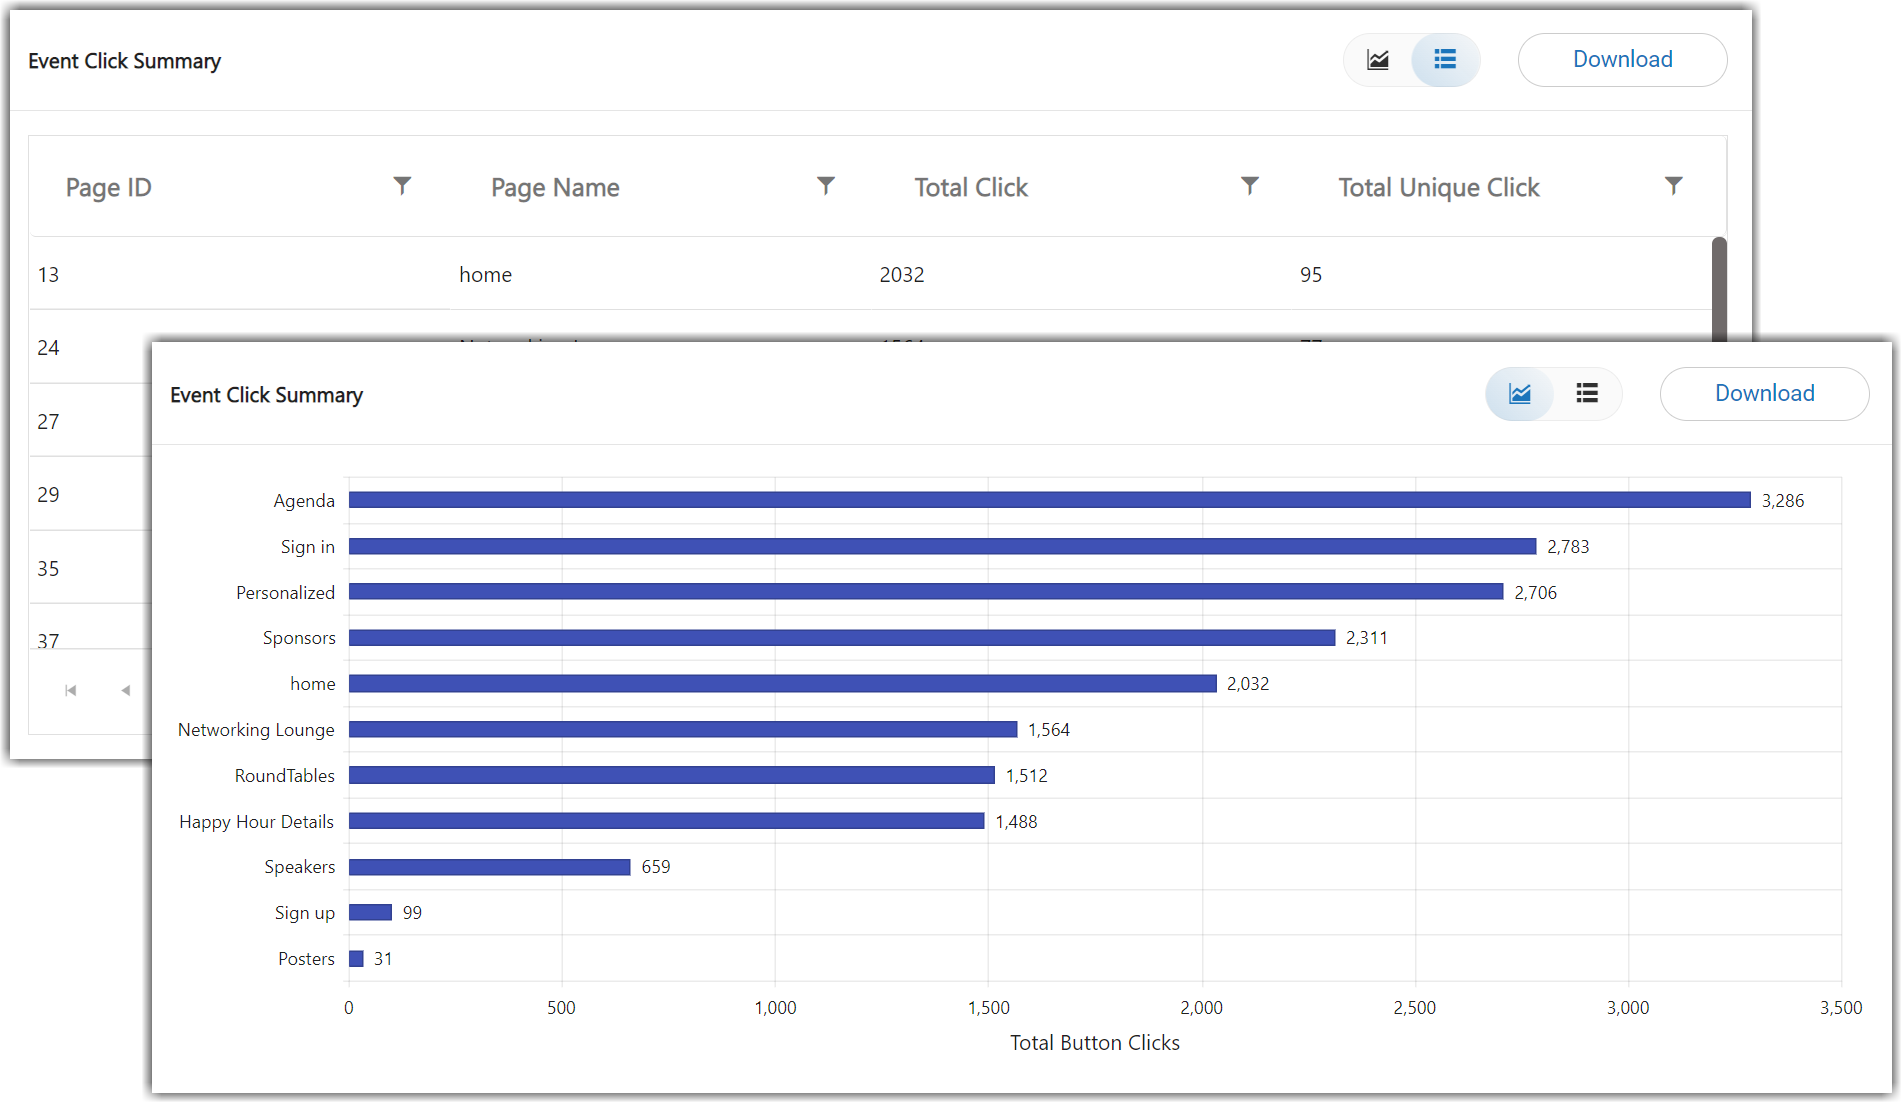
This summary report tracks the total and unique numbers of button clicks on each of your event pages.
How Can I Use This Report?
- Discover which pages are seeing the most click traffic from your event attendees.
![]() Further Reading:
Further Reading:
Comments
1 comment
This article has been updated to include two new user reports: Button Clicks and Event Click Summary.
Please sign in to leave a comment.