The Social27 Analytics Dashboard will allow you to:
- Identify the most active attendees in your event, and locate and engage influencers and highly sought-after attendees
- Understand how the platform is used before, during, and after your event so you can make plans for improvements
- Measure the return on investment (ROI) for your exhibitors and sponsors
- Quantify networking and ROI, and understand your audience better
To find these reports, log in to the Events Builder and use the left navigation menu to navigate to Analytics, then click the Dashboard tab. Use the lower jump menu to navigate directly to a specific report or scroll down to view them all. Don’t forget to set your date range in the top right corner of the screen. For a full list of all fields that appear in the Dashboard reports, check out this spreadsheet.
_
The Dashboard reports include:
- Overview
- Registration Trends
- Most Engaged Companies
- Top Performers
- Featured Page Visits
- Attendance
- Sponsors/Sessions
- Networking/Roundtables
- User Activity
Overview
The Overview report provides basic, high-level numbers about how many users have registered for your event and how many are currently logged in to the event. Users Logged In and Not Logged In represent the number of users with, or without, any activity on the site during your selected date range.
A user is considered Logged In if they have any activity on the site in the selected date range, including logging in. So an attendee will be considered Logged In on May 11 if they logged in on the night of the May 10 but were still active on May 11. An attendee who only logged in, and took no other action will still be considered Logged In. Users Not Logged In displays all other users.

How Can I Use This Report?
- If few attendees are logged in, you can consider contacting them and reminding them about specific features of the event they might be missing out on.
Registration Trends
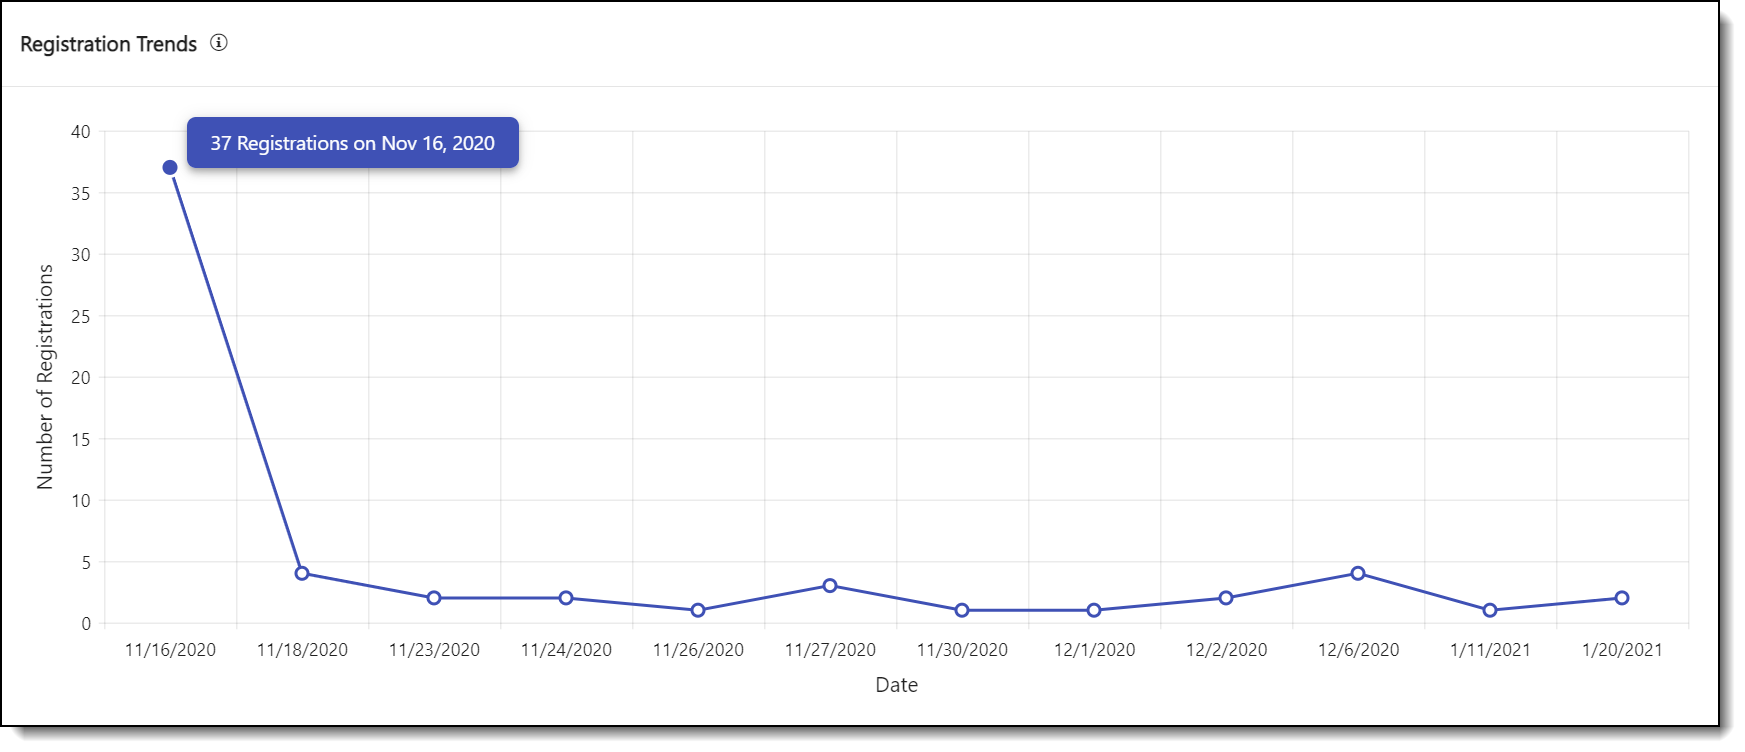
The Registration Trends report displays the number of users who have registered for the event over time. Hovering over each data point in the graph view will reveal the exact number of users who registered on that date. To view the full registration report, navigate to the Users tab.
A user is considered “Registered” when their registration information is imported into Social27. Note that if you are using an API or bulk uploading your registrations, your metrics may not reflect when the attendee themselves registered. Contact your CSM about setting up registration for your event.
How Can I Use This Report?
- Trends can be useful to track if your event registrations will match your projections. Every event is different and it’s usually best to compare your trend to your previous events to predict final counts.
Most Engaged Companies
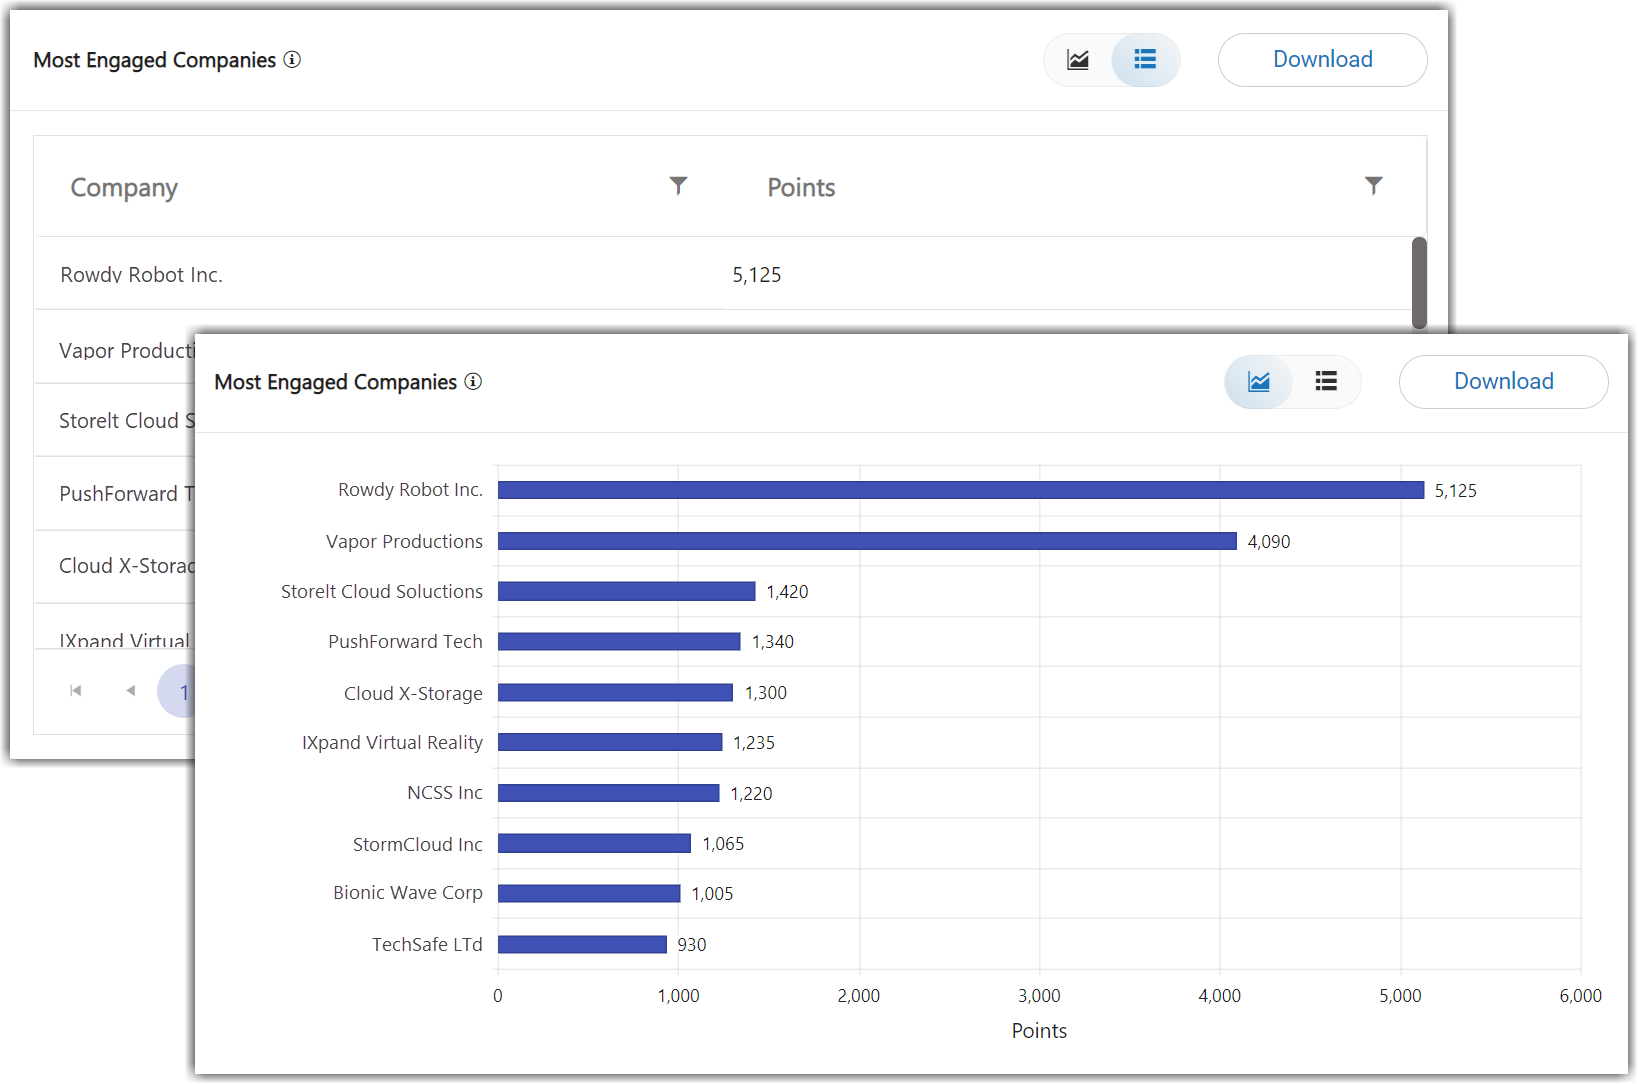
The Most Engaged Companies report groups your attendees by company and shows you which companies are most active in your event and have received the most points from Social27's gamification. (For more gamification data, check out the Gamification Dashboard.)
How Can I Use This Report?
- Understand which companies are most active in your event and using the gamification features of the platform.
Top Performers
The Top Performers report highlights top performers across the entire event. These totals include data based on the actions of all users of your site. Top performers can be attendees, speakers, sponsors, or sessions:

How Can I Use This Report?
- Top performers can give you a good sense of the types of users, pages, and content that are most active or most popular on your site.
Featured Page Visits
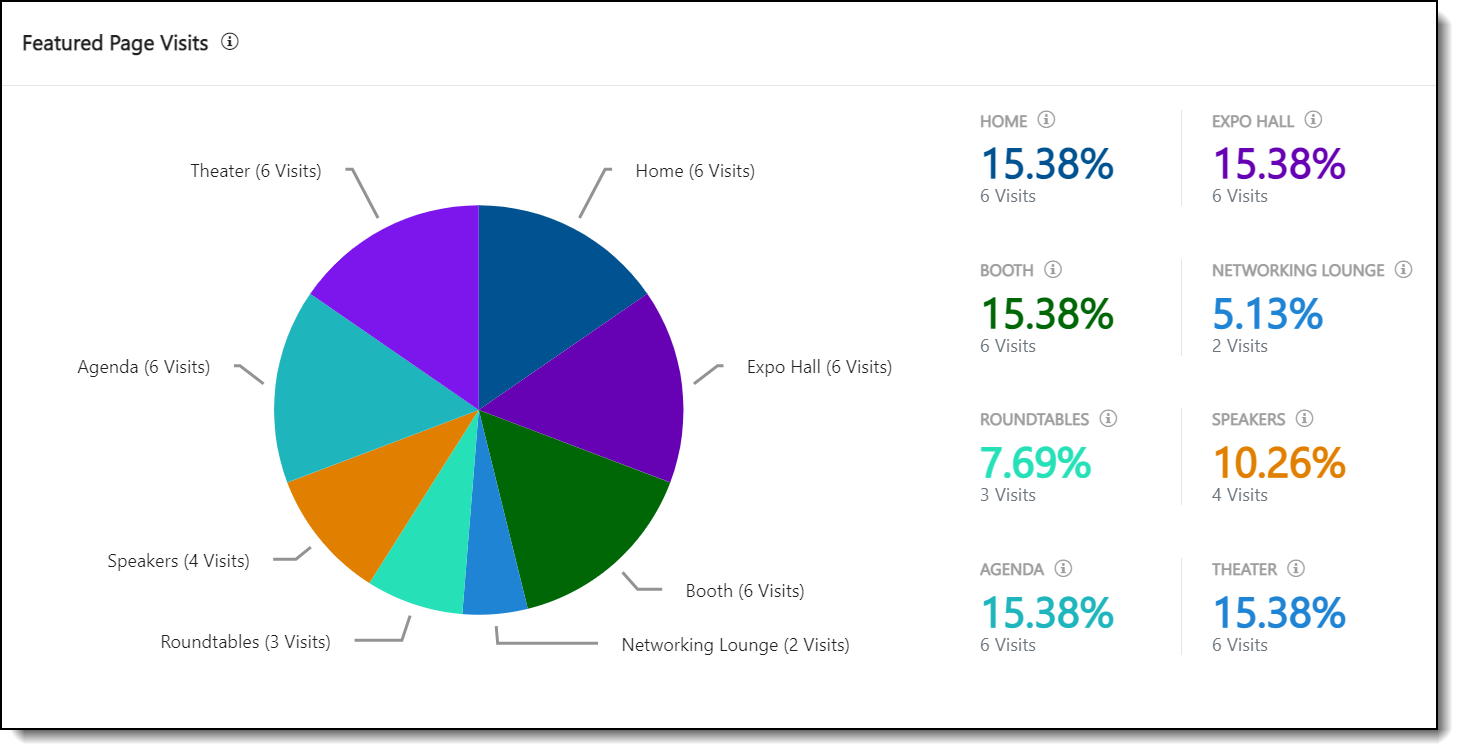
The Featured Page Visits report displays the page view rates of users. Rates are calculated by comparing the total unique user views of each featured page to the views of all featured pages. A unique view means that each attendee’s view of a page is counted only once; repeat views of the same page by the same user will not count as multiple views.
Featured pages are selected pages that appear in the left navigation panel on the event site. You may not see all of your event’s pages in this list, or may see pages that your event is not currently using.
How Can I Use This Report?
- This chart can give you a good idea of which pages are being visited the most often. For example, it may show you that attendees are spending more time on Sessions and session theater pages than with the Expo Hall and sponsors booths.
Attendance
The Attendance report provides the conversion rates from registration to attendance and feature usage. That is, the report shows the number of users who registered for the event compared to the number of users who actually attended the event.
This section shows conversion rates for attendees, Roundtables, sessions, and Happy Hours.
- A user is considered “Attended” if they have taken any action on the event site.
- A user “Launched” a Roundtable or Boardroom if they clicked Launch and is considered “Invited/Joined” to that meeting if they were invited or clicked Join.
- A user “Attended a Session” if they accessed any session for any amount of time. This metric shows the total number of attendees for the entire event who attended one or more sessions; users aren’t counted more than once if they attended multiple sessions.
- Happy Hour attendance considers the number of users who registered for the event and accessed a Happy Hour for any amount of time.

How Can I Use This Report?
- If your registrations aren’t turning into attendance, you can remind attendees of the Add to Calendar options for sessions, Roundtables, and Boardrooms.
- Set up a notification or send out an email to remind attendees about your sessions, Roundtables, and Happy Hours.
Sponsors/Sessions
Sponsors
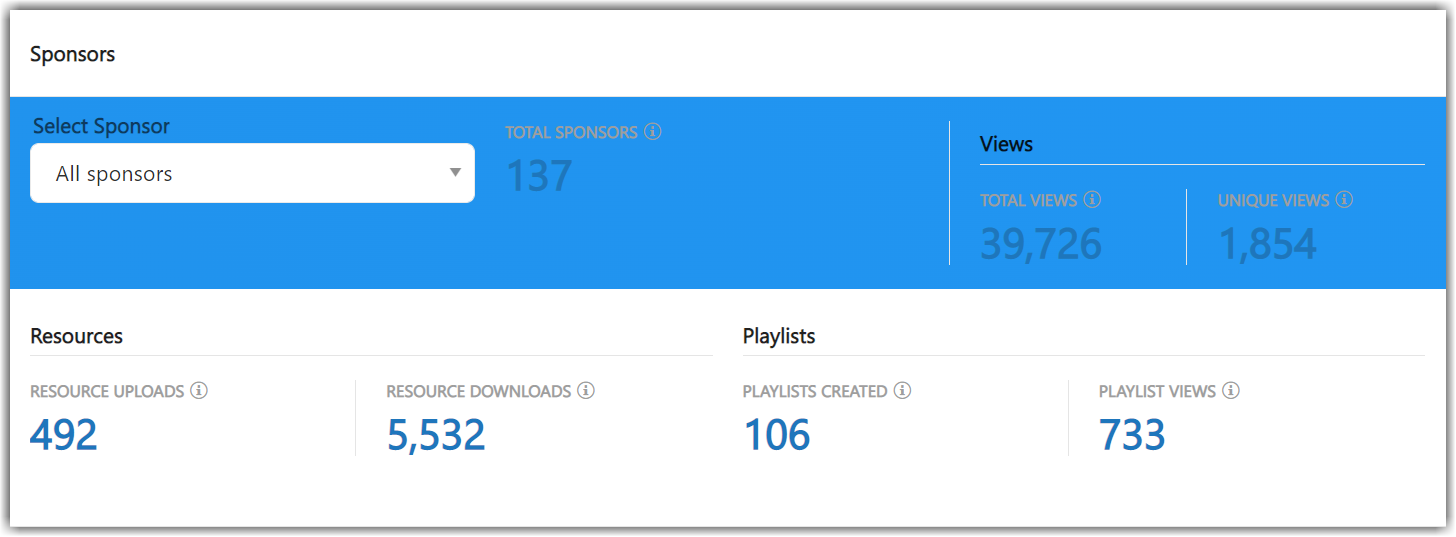
This report presents metrics that can help you understand attendee interest in your event sponsors and measure your ROI. Metrics include sponsor page views, resource downloads/uploads, and Playlist creations/views.
These metrics include visits from all event users of all types (attendees, speakers, booth reps, etc.; no user is excluded) and a view is when as a single user views a single page. If a user visits the same page twice, the Total Views metric will count both visits, but the Unique Views metric will only count one visit.
Use the Select Sponsor drop-down menu to specify whether you would like to review metrics for all sponsors or a specific sponsor.
The Total Sponsors metric displays a count of all event sponsors, regardless of the selected date range.
How Can I Use This Report?
- If you see low numbers of Playlists or resources, you can add them to your sponsors pages or request that your sponsors do so.
- Use these metrics to help plan incentives that will drive attendees your sponsor booths.
Sessions
This report presents metrics that can help you understand attendee interest and participation in your sessions. Metrics include number of speakers, speaker activity, and resource downloads/uploads.
Use the Select Session drop-down menu to specify whether you would like to review metrics for all sessions or a specific session.
The Total Sessions metric shows a count of all sessions in your event, regardless of the selected date range:

How Can I Use This Report?
- If you find that your sessions don’t have many resources, you can reach out to your speakers and request that they consider including some.
- Set up a notification to remind attendees about your sessions to increase your session views.
Networking and Roundtables
This report measures the chats exchanged, attendance at Happy Hours/Roundtables/Boardrooms, and connections made throughout your event.
Connections are made whenever a Connect button is clicked. The Connect button appears on user profiles in sponsor pages, in Roundtables and Boardrooms, in chats and in the Networking Lounge. Note that a connection can be counted twice if both parties “Connect” with each other.
Total Chats counts all chats on the platform, including user-to-user, Q&A, sessions, sponsor pages, Happy Hours, and posters.

How Can I Use This Report?
- Consider scheduling Roundtables, Boardrooms, and Happy Hours if your networking numbers are low.
- Make sure your attendees understand how to make connections on the Social27 platform.
User Activity
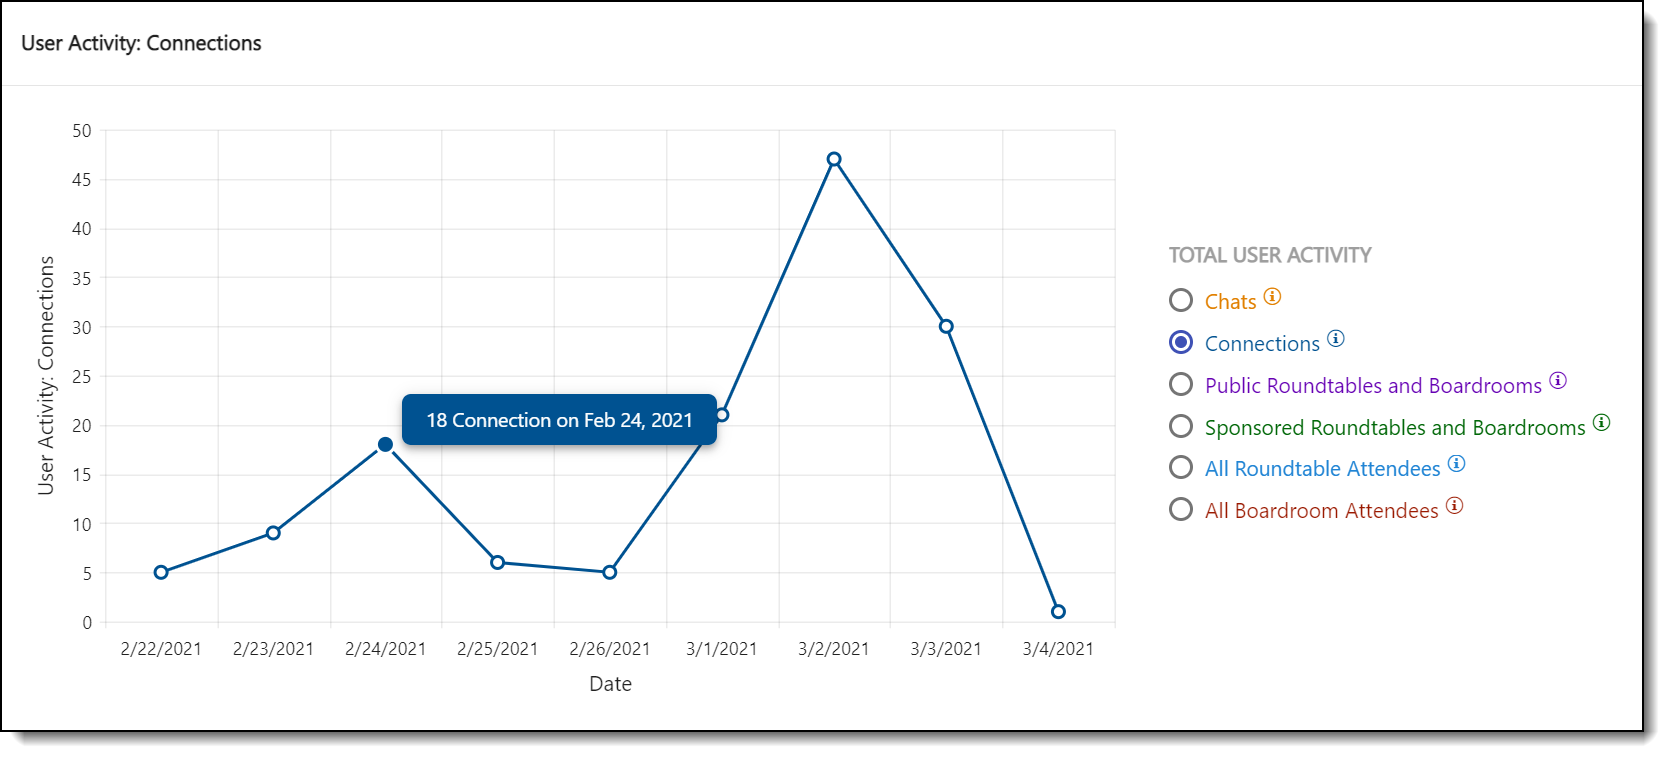
This graph displays user activity over time and includes all actions by all users. Roundtable and Boardroom activity measures the total count of meetings, not the number of meeting invitees or attendees.
Click the bubble beside each activity type to populate the graph with that activity’s data:
How Can I Use This Report?
- If Roundtable or Boardroom use has dropped off, consider creating some new meetings.
- Request that your event organizers or moderators begin chats during sessions or by reaching out to users directly.
- Make sure your sponsors understand how sponsored Roundtables and Boardrooms can drive their ROI.
![]() Further Reading: Check out the rest of Social27’s Reporting articles.
Further Reading: Check out the rest of Social27’s Reporting articles.
Comments
1 comment
This article has been updated to reflect the current state of Social27 Analytics, including a new Most Engaged Companies report.
Please sign in to leave a comment.