The Social27 Analytics Engagement Dashboard helps you understand how users are engaging in your event. You can use these reports to understand:
- The number of areas of interest (AOIs) are in your event
- How many Hello World! and Soapbox videos are uploaded to your event
- Attendee responses to surveys and polls
To access the Engagement Dashboard, log in to the Events Builder and use the left navigation menu to navigate to Analytics, then click the Roundtables tab. Use the Download buttons if you wish to download the reports from the Engagement Dashboard. For a full list of all fields that appear in the Engagement reports, check out this spreadsheet.

The Engagement Dashboard includes the following reports:
Overview Statistics
The overview statistics located at the top of the page give you an at-a-glance understanding of your event's AOIs, Hello World! videos and Soapbox videos.

Surveys
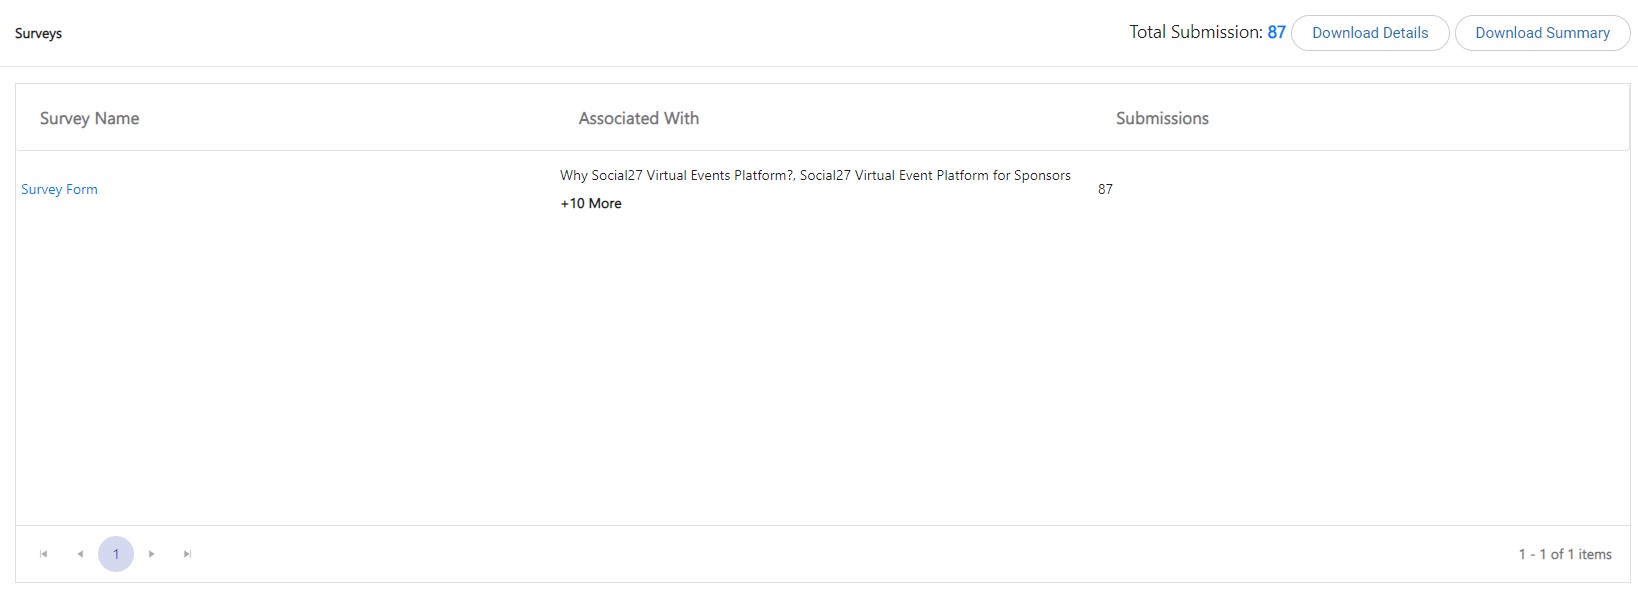
The Surveys report includes all surveys that have been created in your event.
Click Download Details to download a report that includes all responses to every event survey. Each row on this report is related to a single user and shows which survey they answered, which session the survey belonged to, and the response they gave. All user information, including name, role, department, etc. is also included.
Click Download Summary to find a general report that tells you how many submissions each survey received.
 |
|
|
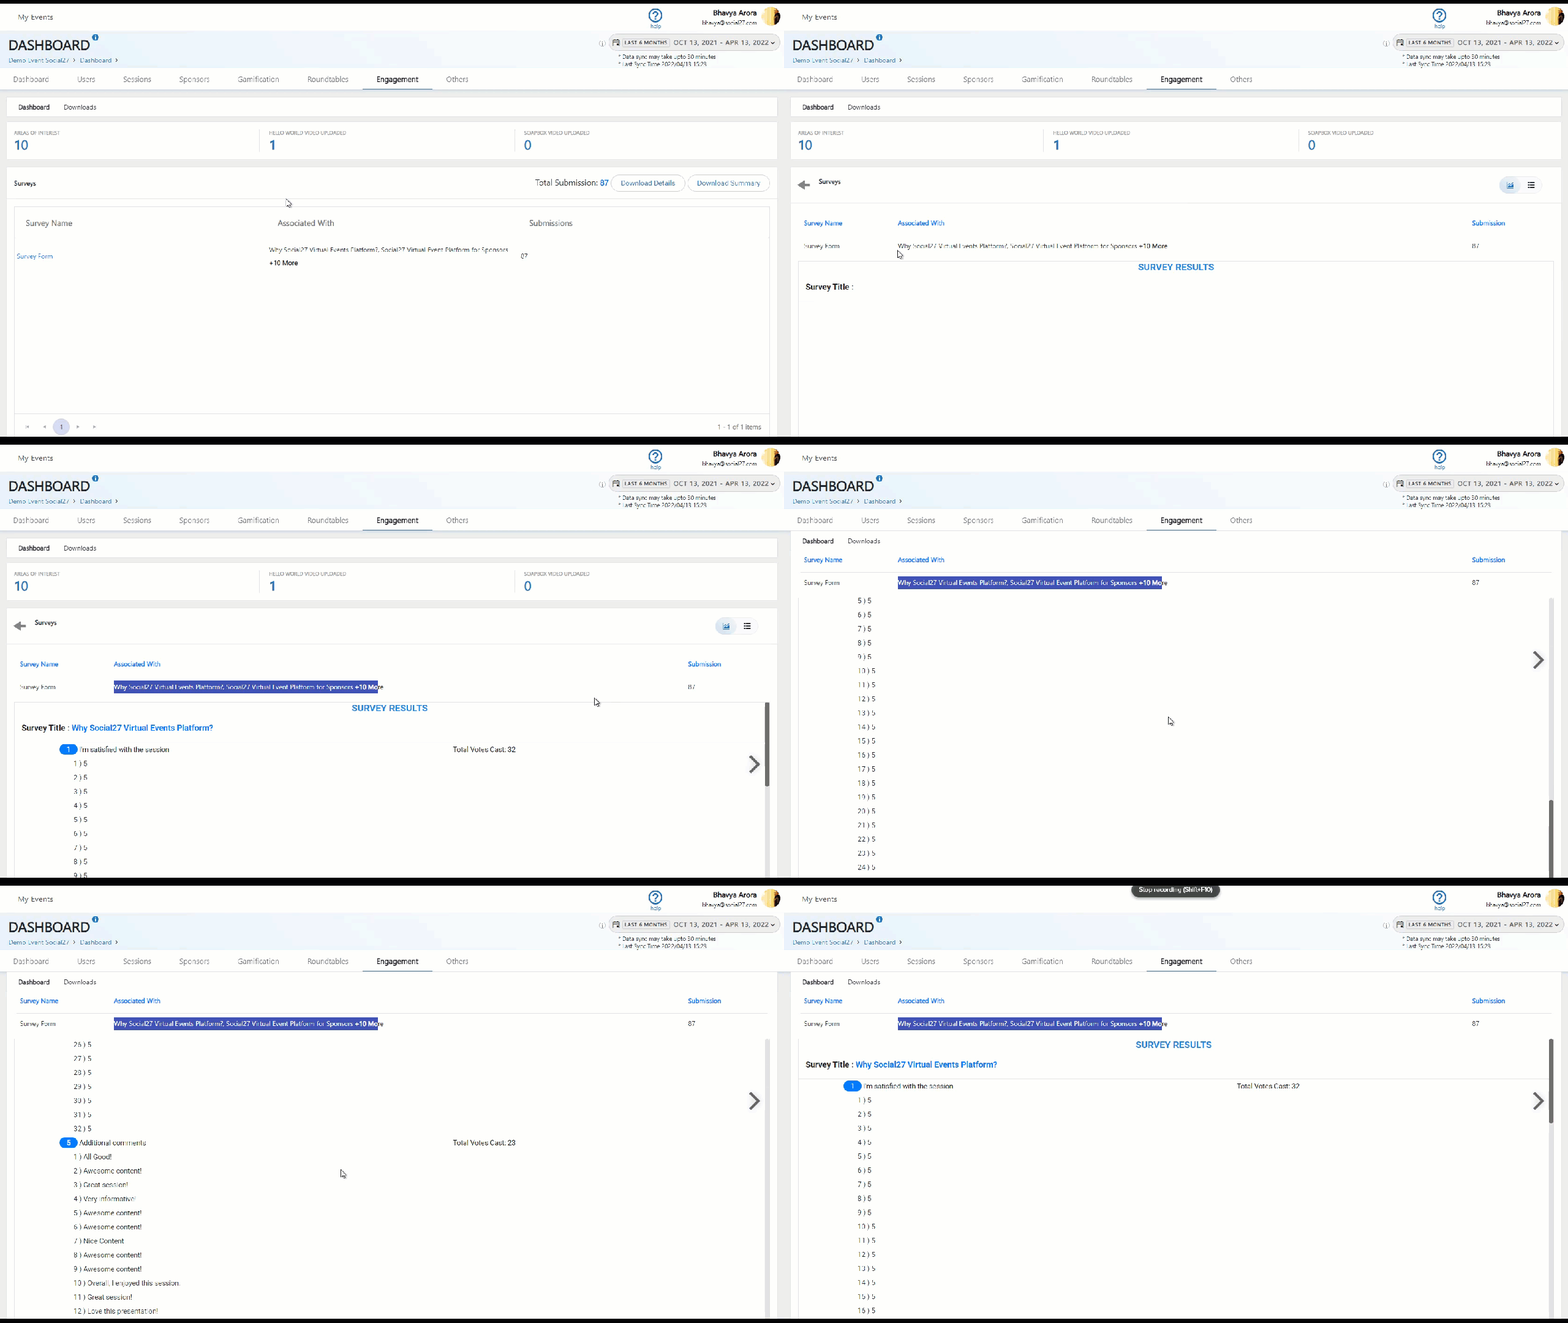
Clicking a survey name will reveal all of the survey questions and a percentage of how many attendees selected each answer option.

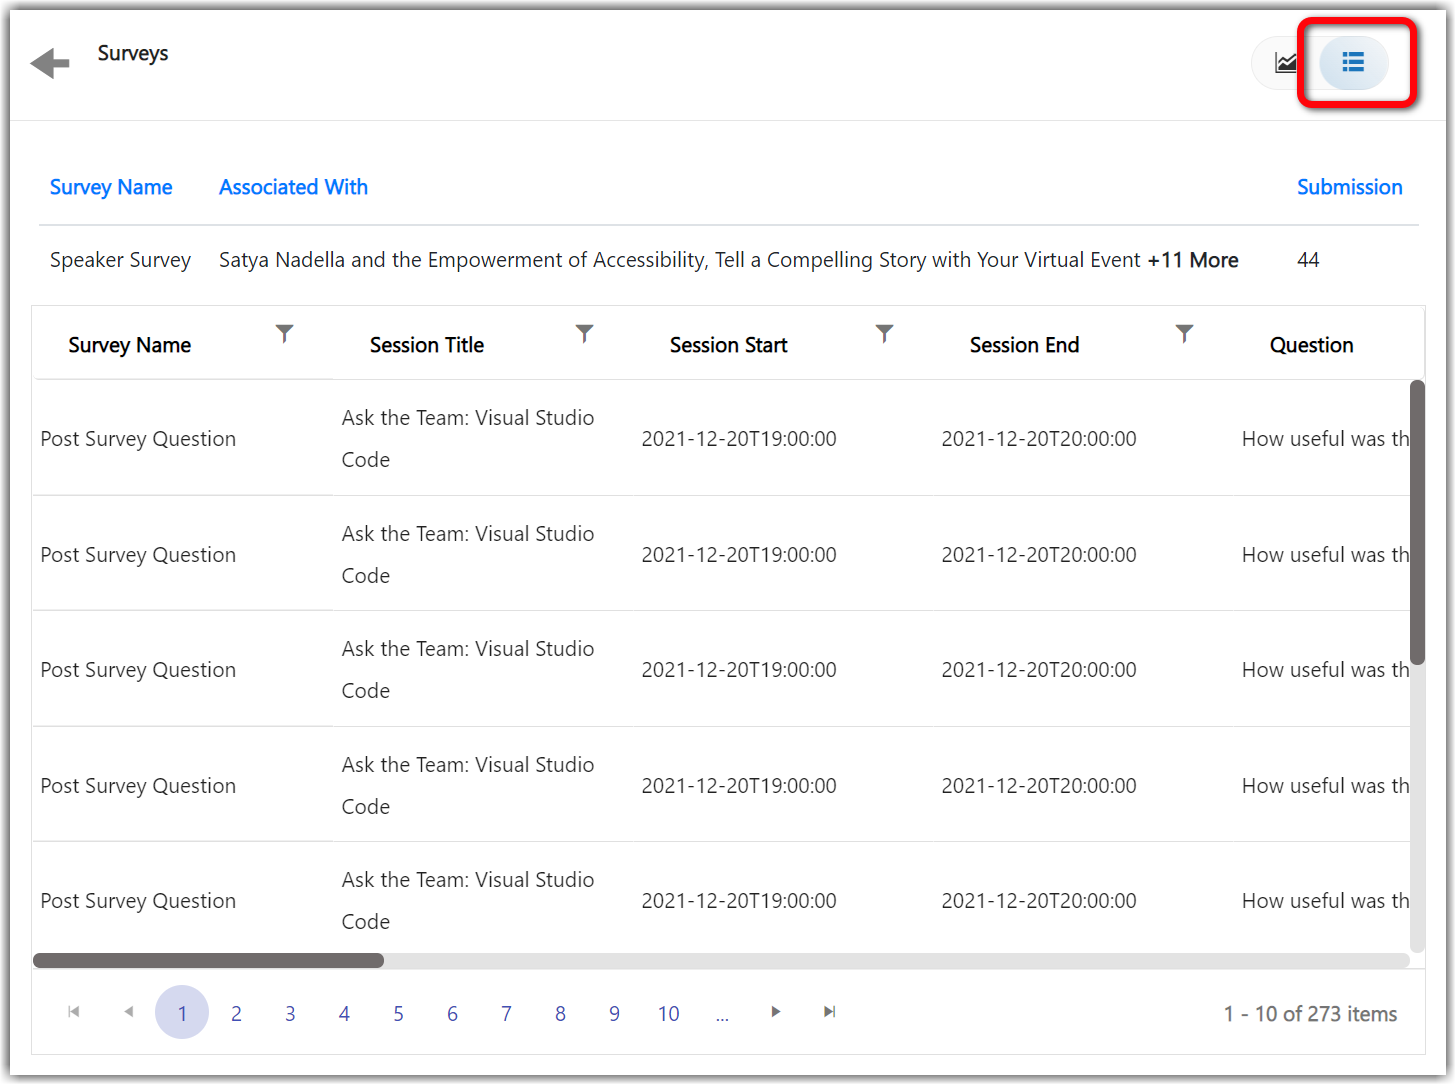
Clicking the table icon will change the display to table format, which includes the same additional user-specific information that is included in excel file that you can download by clicking Download Details (user name and information, which session the survey is part of, how they answered, etc.)

Polls Report
The Polls report displays all polls that were created for your event.

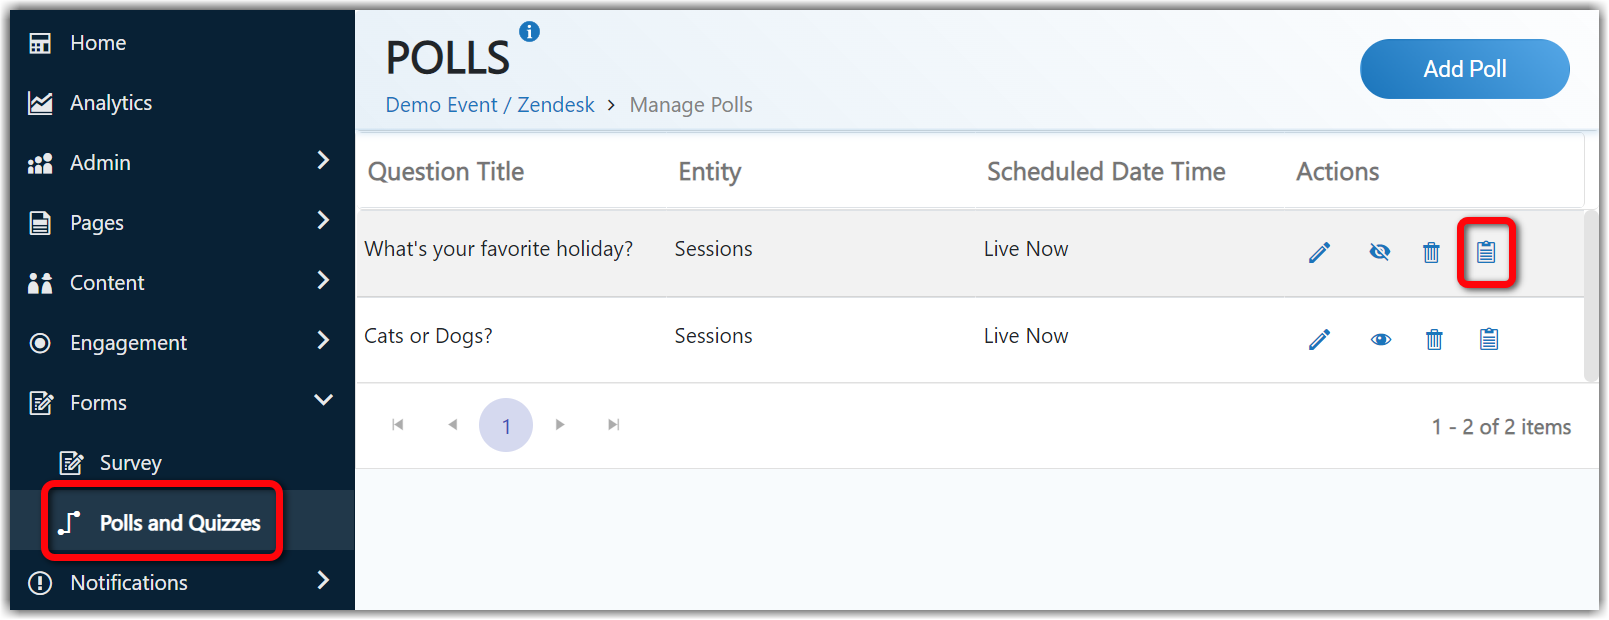
If you enabled the newer version of polls, those poll results currently appear on the Polls page (Forms > Polls). Clicking the clipboard icon  will display your poll results.

You'll see a list of all users who have responded to the poll. Click View Response Percentages to see the percentage of responses for each option and View Details to see how each individual user answered the question.

![]() Further Reading:
Further Reading:

Comments
0 comments
Please sign in to leave a comment.